

Assessment of a livestock GPS collar based on an open-source datalogger informs best practices for logging intensity
- PMID: 29938081
- PMCID: PMC6010917
- DOI: 10.1002/ece3.4094
Assessment of a livestock GPS collar based on an open-source datalogger informs best practices for logging intensity
Abstract
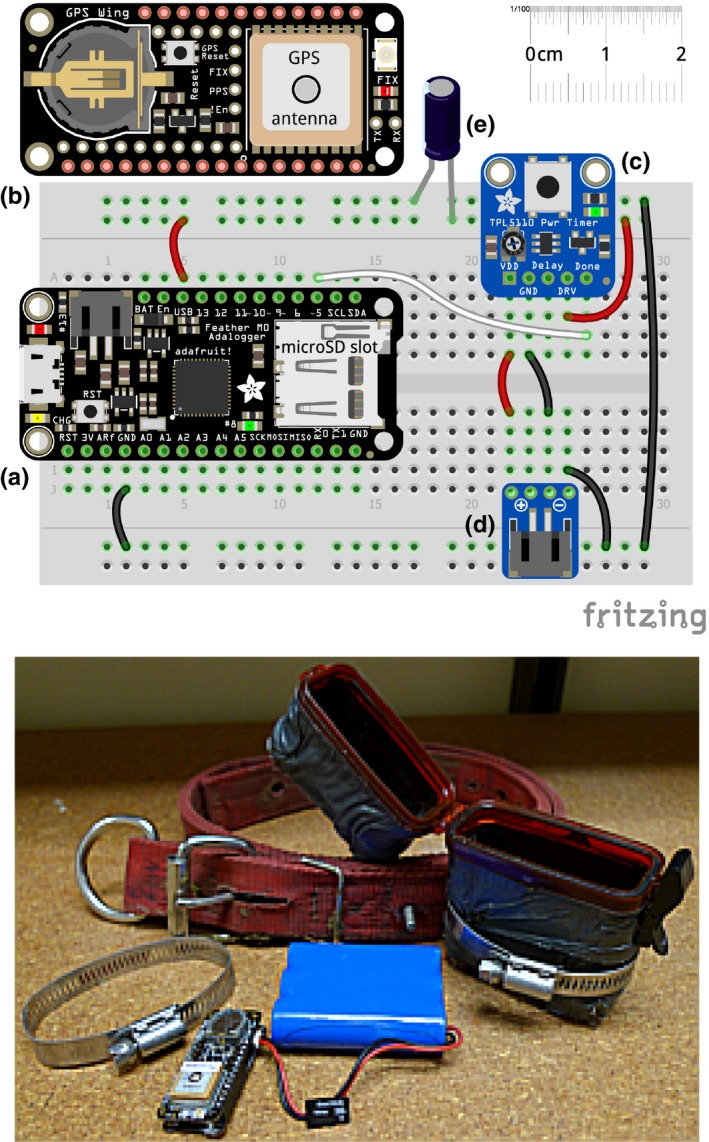
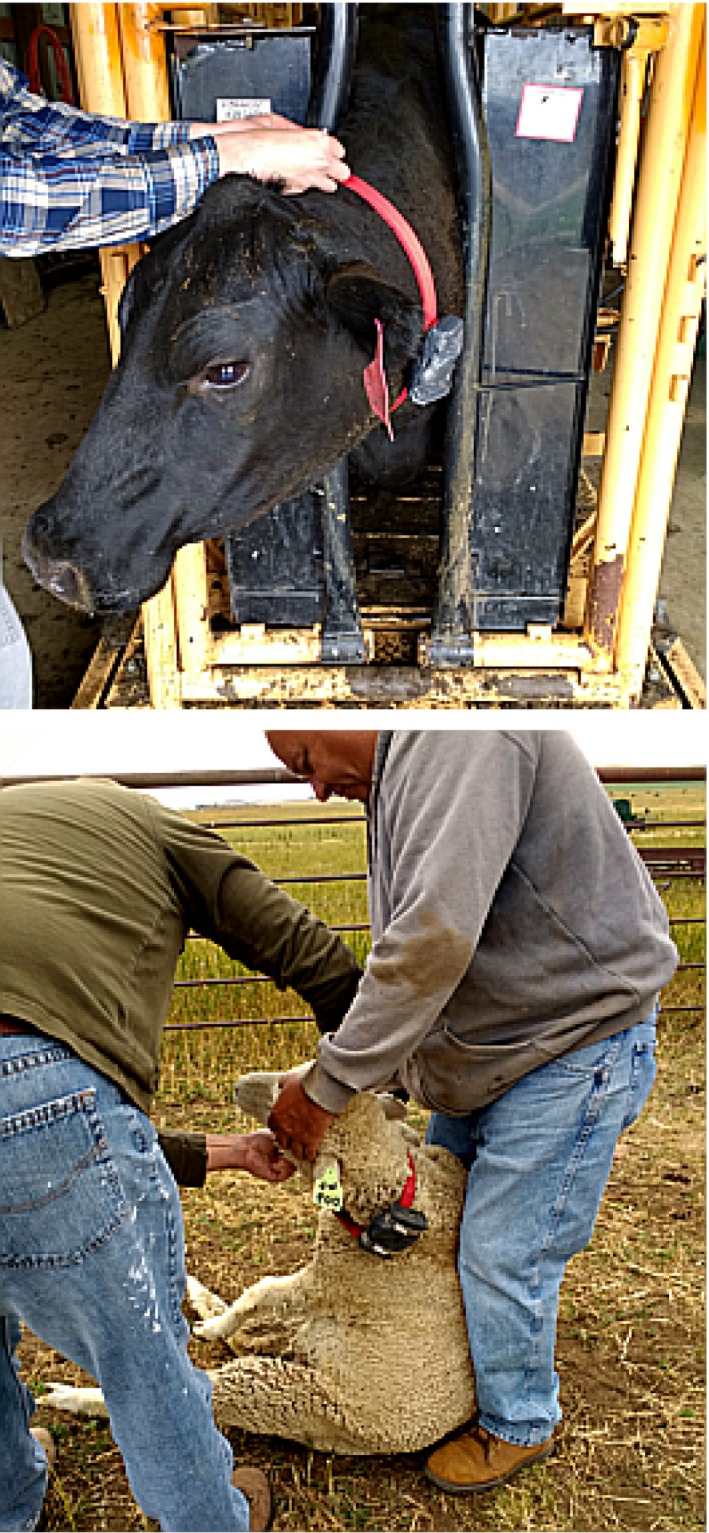
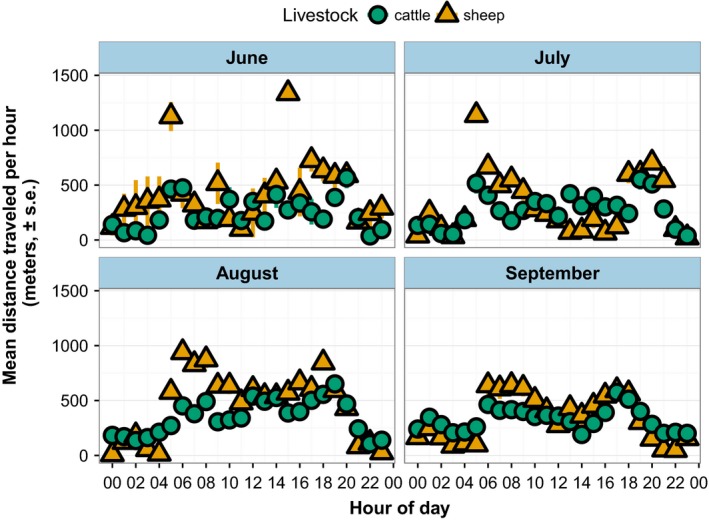
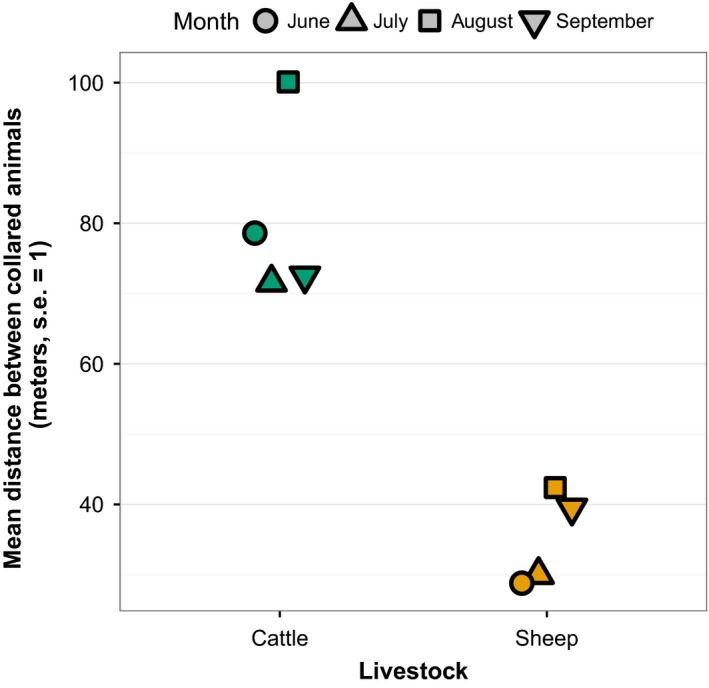
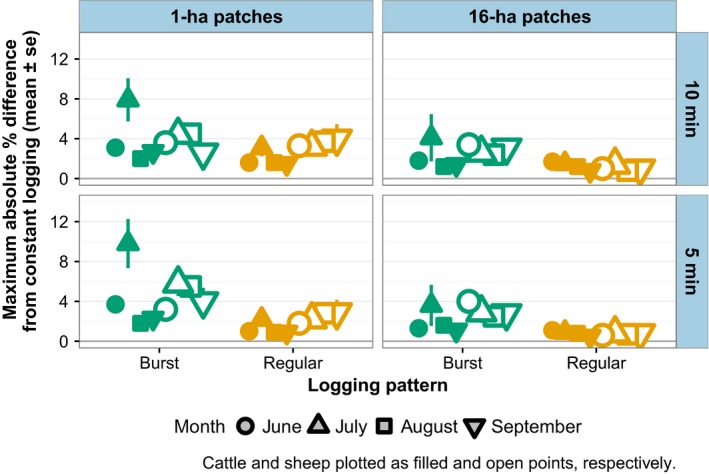
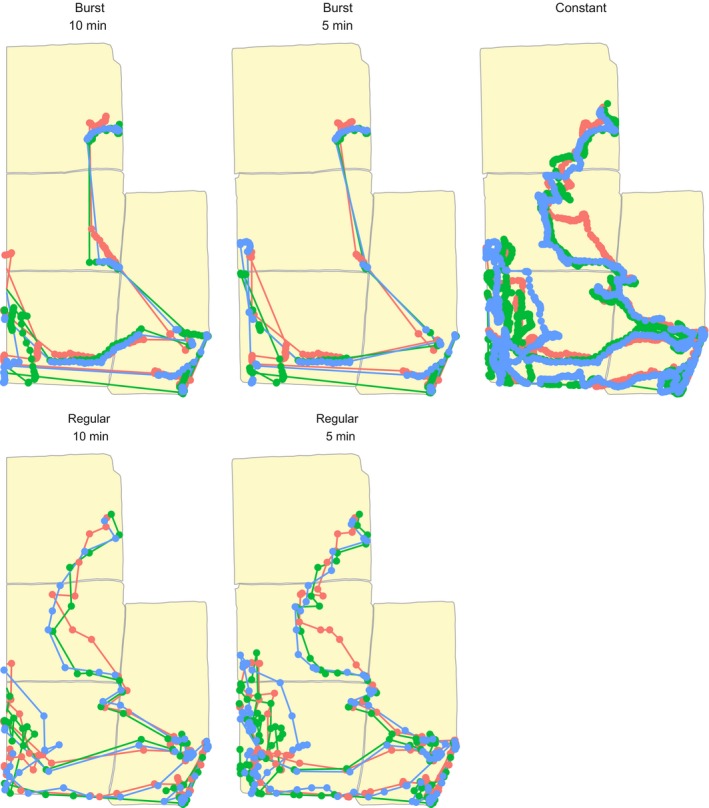
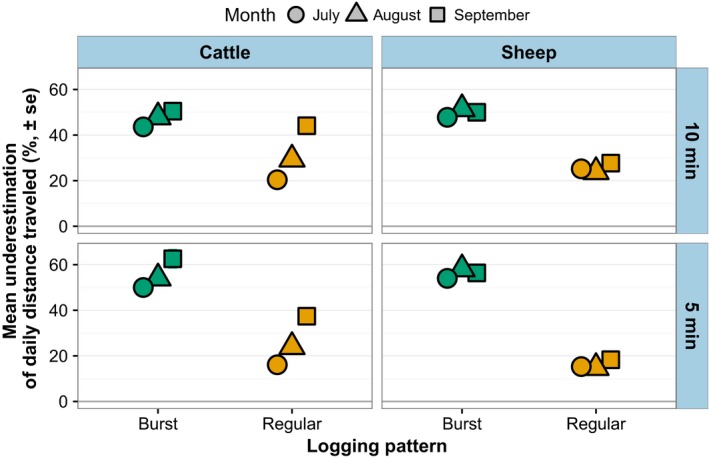
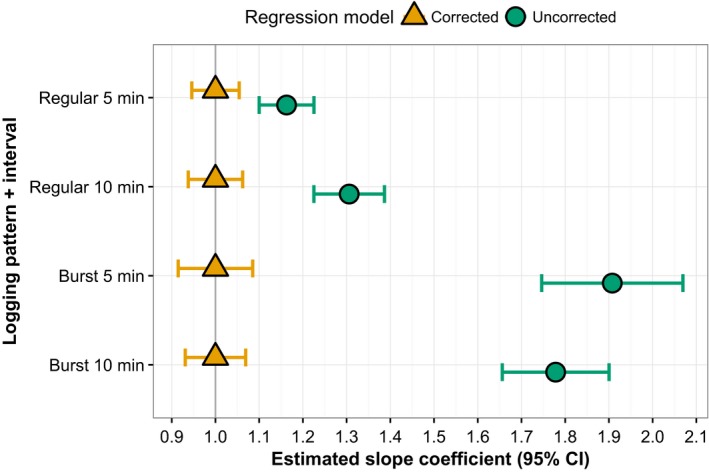
Ecologists have used Global Positioning Systems (GPS) to track animals for 30 years. Issues today include logging frequency and precision in estimating space use and travel distances, as well as battery life and cost. We developed a low-cost (~US$125), open-source GPS datalogger based on Arduino. To test the system, we collected positions at 20-s intervals for several 1-week durations from cattle and sheep on rangeland in North Dakota. We tested two questions of broad interest to ecologists who use GPS collars to track animal movements: (1) How closely do collared animals cluster in their herd? (2) How well do different logging patterns estimate patch occupancy and total daily distance traveled? Tested logging patterns included regular logging (one position every 5 or 10 min), and burst logging (positions recorded at 20-s intervals for 5 or 10 min per hour followed by a sleep period). Collared sheep within the same pasture spent 75% of daytime periods within 51 m of each other (mean = 42 m); collared cattle were within 111 m (mean = 76 m). In our comparison of how well different logging patterns estimate space use versus constant logging, the proportion of positions recorded in 1- and 16-ha patches differed by 2%-3% for burst logging and 1% for regular logging. Although all logging patterns underestimated total daily distance traveled, underestimations were corrected by multiplying estimations by regression coefficients estimated by maximum likelihood. Burst logging can extend battery life by a factor of 7. We conclude that a minimum of two collars programmed with burst logging robustly estimate patch use and spatial distribution of grazing livestock herds. Research questions that require accurately estimating travel of individual animals, however, are probably best addressed with regular logging intervals and will thus have greater battery demands than spatial occupancy questions across all GPS datalogger systems.
Keywords: Arduino; DIY ecology; animal tracking; behavioral ecology; space use patterns.
Figures
Similar articles
-
Use of GPS tracking collars and accelerometers for rangeland livestock production research.Transl Anim Sci. 2018 Jan 25;2(1):81-88. doi: 10.1093/tas/txx006. eCollection 2018 Feb. Transl Anim Sci. 2018. PMID: 32704691 Free PMC article.
-
Spatial occupancy patterns and activity of arid rangeland cattle grazing small riparian pastures.Anim Sci J. 2017 Mar;88(3):553-558. doi: 10.1111/asj.12670. Epub 2016 Jul 29. Anim Sci J. 2017. PMID: 27468941
-
Patterns of livestock activity on heterogeneous subalpine pastures reveal distinct responses to spatial autocorrelation, environment and management.Mov Ecol. 2015 Oct 8;3:35. doi: 10.1186/s40462-015-0053-6. eCollection 2015. Mov Ecol. 2015. PMID: 26457186 Free PMC article.
-
Review: Precision Livestock Farming technologies in pasture-based livestock systems.Animal. 2022 Jan;16(1):100429. doi: 10.1016/j.animal.2021.100429. Epub 2021 Dec 22. Animal. 2022. PMID: 34953277 Review.
-
Review of GPS collar deployments and performance on nonhuman primates.Primates. 2020 May;61(3):373-387. doi: 10.1007/s10329-020-00793-7. Epub 2020 Jan 21. Primates. 2020. PMID: 31965380 Free PMC article. Review.
Cited by
-
Application of Precision Technologies to Characterize Animal Behavior: A Review.Animals (Basel). 2024 Jan 27;14(3):416. doi: 10.3390/ani14030416. Animals (Basel). 2024. PMID: 38338058 Free PMC article. Review.
-
A Range-Based Algorithm for Autonomous Navigation of an Aerial Drone to Approach and Follow a Herd of Cattle.Sensors (Basel). 2021 Oct 29;21(21):7218. doi: 10.3390/s21217218. Sensors (Basel). 2021. PMID: 34770525 Free PMC article.
-
A Decision Support System for Economically Sustainable Sheep and Goat Farming.Animals (Basel). 2020 Dec 17;10(12):2421. doi: 10.3390/ani10122421. Animals (Basel). 2020. PMID: 33348834 Free PMC article.
-
Developing a Simulated Online Model That Integrates GNSS, Accelerometer and Weather Data to Detect Parturition Events in Grazing Sheep: A Machine Learning Approach.Animals (Basel). 2021 Jan 25;11(2):303. doi: 10.3390/ani11020303. Animals (Basel). 2021. PMID: 33503953 Free PMC article.
-
Convergent Validation of a Self-Reported Commuting to and from School Diary in Spanish Adolescents.Int J Environ Res Public Health. 2022 Dec 20;20(1):18. doi: 10.3390/ijerph20010018. Int J Environ Res Public Health. 2022. PMID: 36612339 Free PMC article.
References
-
- Akasbi, Z. , Oldeland, J. , Dengler, J. , & Finckh, M. (2012). Analysis of GPS trajectories to assess goat grazing pattern and intensity in Southern Morocco. The Rangeland Journal, 34, 415–427. https://doi.org/10.1071/RJ12036 - DOI
-
- Allred, B. W. , Fuhlendorf, S. D. , & Hamilton, R. G. (2011). The role of herbivores in Great Plains conservation: Comparative ecology of bison and cattle. Ecosphere, 2, art26.
-
- Allred, B. W. , Fuhlendorf, S. D. , Hovick, T. J. , Dwayne Elmore, R. , Engle, D. M. , & Joern, A. (2013). Conservation implications of native and introduced ungulates in a changing climate. Global Change Biology, 19, 1875–1883. https://doi.org/10.1111/gcb.12183 - DOI - PubMed
-
- Augustine, D. J. , & Derner, J. D. (2013). Assessing herbivore foraging behavior with GPS collars in a semiarid grassland. Sensors, 13, 3711–3723. https://doi.org/10.3390/s130303711 - DOI - PMC - PubMed
-
- Bailey, D. W. , Keil, M. R. , & Rittenhouse, L. R. (2004). Research observation: Daily movement patterns of hill climbing and bottom dwelling cows. Rangeland Ecology & Management, 57, 20–28.
LinkOut - more resources
Full Text Sources
Other Literature Sources
