

Density-dependent and density-independent drivers of population change in Barton Springs salamanders
- PMID: 29938103
- PMCID: PMC6010705
- DOI: 10.1002/ece3.4130
Density-dependent and density-independent drivers of population change in Barton Springs salamanders
Abstract
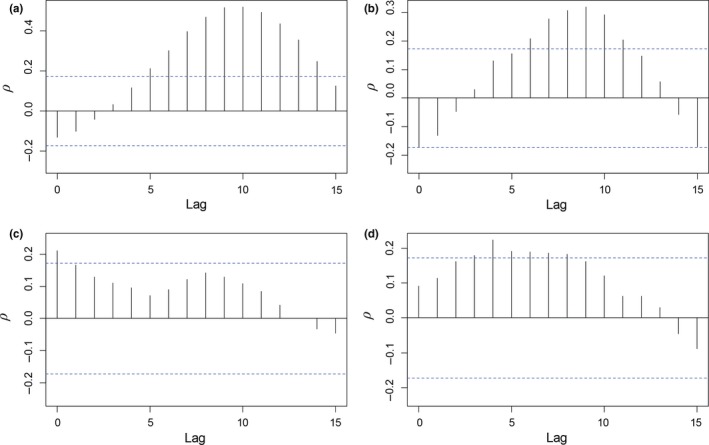
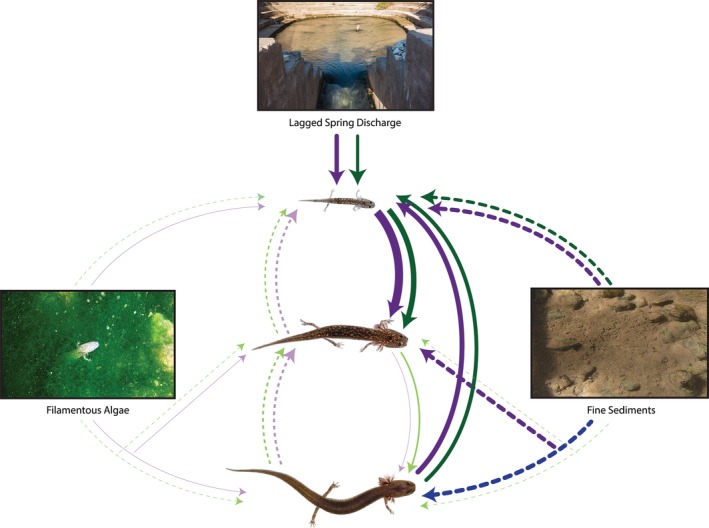
Understanding population change is essential for conservation of imperiled species, such as amphibians. Worldwide amphibian declines have provided an impetus for investigating their population dynamics, which can involve both extrinsic (density-independent) and intrinsic (density-dependent) drivers acting differentially across multiple life stages or age classes. In this study, we examined the population dynamics of the endangered Barton Springs Salamander (Eurycea sosorum) using data from a long-term monitoring program. We were interested in understanding both the potential environmental drivers (density-independent factors) and demographic factors (interactions among size classes, negative density dependence) to better inform conservation and management activities. We used data from three different monitoring regimes and multivariate autoregressive state-space models to quantify environmental effects (seasonality, discharge, algae, and sediment cover), intraspecific interactions among three size classes, and intra-class density dependence. Results from our primary data set revealed similar patterns among sites and size classes and were corroborated by our out-of-sample data. Cross-correlation analysis showed juvenile abundance was most strongly correlated with a 9-month lag in aquifer discharge, which we suspect is related to inputs of organic carbon into the aquifer. However, sedimentation limited juvenile abundance at the surface, emphasizing the importance of continued sediment management. Recruitment from juveniles to the sub-adult size class was evident, but negative density-dependent feedback ultimately regulated each size class. Negative density dependence may be an encouraging sign for the conservation of E. sosorum because populations that can reach carrying capacity are less likely to go extinct compared to unregulated populations far below their carrying capacity. However, periodic population declines coupled with apparent migration into the aquifer complicate assessments of species status. Although both density-dependent and density-independent drivers of population change are not always apparent in time series of animal populations, both have important implications for conservation and management of E. sosorum.
Keywords: Eurycea sosorum; MARSS; density‐dependence; density‐independence; endangered species; karst aquifer; long‐term monitoring; time series analysis.
Figures


Similar articles
-
Subterranean movement inferred by temporary emigration in Barton Springs salamanders (Eurycea sosorum).PeerJ. 2021 Apr 23;9:e11246. doi: 10.7717/peerj.11246. eCollection 2021. PeerJ. 2021. PMID: 33981501 Free PMC article.
-
Effects of nitrogenous wastes on survival of the Barton Springs salamander (Eurycea sosorum).Environ Toxicol Chem. 2017 Nov;36(11):3003-3007. doi: 10.1002/etc.3865. Epub 2017 Jul 28. Environ Toxicol Chem. 2017. PMID: 28543305
-
A Vavraia-like microsporidium as the cause of deadly infection in threatened and endangered Eurycea salamanders in the United States.Parasit Vectors. 2019 Mar 14;12(1):108. doi: 10.1186/s13071-019-3369-z. Parasit Vectors. 2019. PMID: 30871588 Free PMC article.
-
The complexity of amphibian population declines: understanding the role of cofactors in driving amphibian losses.Ann N Y Acad Sci. 2011 Mar;1223:108-19. doi: 10.1111/j.1749-6632.2010.05909.x. Ann N Y Acad Sci. 2011. PMID: 21449968 Review.
-
Management and research strategies of karst aquifers in Greece: Literature overview and exemplification based on hydrodynamic modelling and vulnerability assessment of a strategic karst aquifer.Sci Total Environ. 2018 Dec 1;643:592-609. doi: 10.1016/j.scitotenv.2018.06.184. Epub 2018 Jun 24. Sci Total Environ. 2018. PMID: 29957427 Review.
Cited by
-
Demography and space-use of Eastern Red-backed Salamanders (Plethodon cinereus) between mature and successional forests.Ecol Evol. 2023 Jan 24;13(1):e9764. doi: 10.1002/ece3.9764. eCollection 2023 Jan. Ecol Evol. 2023. PMID: 36713486 Free PMC article.
-
Predicting surface abundance of federally threatened Jollyville Plateau Salamanders (Eurycea tonkawae) to inform management activities at a highly modified urban spring.PeerJ. 2022 May 2;10:e13359. doi: 10.7717/peerj.13359. eCollection 2022. PeerJ. 2022. PMID: 35529492 Free PMC article.
-
Subterranean movement inferred by temporary emigration in Barton Springs salamanders (Eurycea sosorum).PeerJ. 2021 Apr 23;9:e11246. doi: 10.7717/peerj.11246. eCollection 2021. PeerJ. 2021. PMID: 33981501 Free PMC article.
References
-
- Allan, J. D. (1995). Stream ecology: Structure and function of running waters. Dordrecht, The Netherlands: Kluwer Academic Publishers; https://doi.org/10.1007/978-94-011-0729-7 - DOI
-
- Altwegg, R. (2003). Multistage density dependence in an amphibian. Oecologia, 136, 46–50. https://doi.org/10.1007/s00442-003-1248-x - DOI - PubMed
-
- Anderson, T. W. (2001). Predator responses, prey refuges, and density‐dependent mortality of a marine fish. Ecology, 82, 245–257. https://doi.org/10.1890/0012-9658(2001)082[0245:PRPRAD]2.0.CO;2 - DOI
-
- Bancila, R. I. , Ozgul, A. , Hartel, T. , Sos, T. , & Schmidt, B. R. (2016). Direct negative density‐dependence in a pond‐breeding frog population. Ecography, 39, 449–455. https://doi.org/10.1111/ecog.01584 - DOI
-
- Barrett, K. , Helms, B. S. , Guyer, C. , & Schoonover, J. E. (2010). Linking process to pattern: Causes of stream‐breeding amphibian decline in urbanized watersheds. Biological Conservation, 143, 1998–2005. https://doi.org/10.1016/j.biocon.2010.05.001 - DOI
LinkOut - more resources
Full Text Sources
Other Literature Sources
