. 2017 Nov;122(11):11716-11742.
doi: 10.1002/2017JA024174. Epub 2017 Nov 20.

Global Ionospheric and Thermospheric Effects of the June 2015 Geomagnetic Disturbances: Multi-Instrumental Observations and Modeling

Affiliations

Global Ionospheric and Thermospheric Effects of the June 2015 Geomagnetic Disturbances: Multi-Instrumental Observations and Modeling

E Astafyeva et al. J Geophys Res Space Phys. 2017 Nov.

Abstract

By using data from multiple instruments, we investigate ionospheric/thermospheric behavior during the period from 21 to 23 June 2015, when three interplanetary shocks (IS) of different intensities arrived at Earth. The first IS was registered at 16:45 UT on 21 June and caused ~50 nT increase in the SYM-H index. The second IS arrived at 5:45 UT on 22 June and induced an enhancement of the auroral/substorm activity that led to rapid increase of thermospheric neutral mass density and ionospheric vertical total electron content at high latitudes. Several hours later, topside electron content and electron density increased at low latitudes on the nightside. The third and much larger IS arrived at 18:30 UT on 22 June and initiated a major geomagnetic storm that lasted for many hours. The storm provoked significant effects in the thermosphere and ionosphere on both dayside and nightside. In the thermosphere, the dayside neutral mass density exceeded the quiet time levels by 300-500%, with stronger effects in the summer hemisphere. In the ionosphere, both positive and negative storm effects were observed on both dayside and nightside. We compared the ionospheric observations with simulations by the coupled Sami3 is Also a Model of the Ionosphere/Rice Convection Model (SAMI3/RCM) model. We find rather good agreement between the data and the model for the first phase of the storm, when the prompt penetration electric field (PPEF) was the principal driver. At the end of the storm main phase, when the ionospheric effects were, most likely, driven by a combination of PPEF and thermospheric winds, the modeling results agree less with the observations.

Keywords: GPS/GNSS; SAMI3/RCM; Swarm; geomagnetic storm; ionosphere; thermosphere.


Figures

Figure 1
Figure 1
Variations of solar wind, interplanetary, and geomagnetic parameters on 20–23 June 2015: (a) solar wind speed V sw, (b) proton density Np, (c) plasma beta parameter, (d) interplanetary magnetic field (IMF) Bx component, (e) the IMF By component, in GSM coordinates (in green), and the IMF averaged magnitude |B| (in black), (f) the IMF Bz component (GSM), (g) interplanetary electric field (IEF) Ey component, calculated as −Bz × V sw, (h) geophysical SYMH index, and (i) the auroral electrojet (AE) index. All the data are 5 min averaged and are available from the OMNIWeb data services (http://omniweb.gsfc.nasa.gov). The dates are shown on the top of the figure; the time of arrivals of the three interplanetary shocks (IS) is indicated by red vertical dashed lines and marked as IS1, IS2, and IS3, respectively, on the top of the upper panel. Thin gray vertical lines mark the 24 UT timelines.
Figure 2
Figure 2
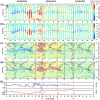
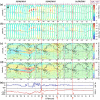
Ionospheric measurements by Swarm B (SWB) satellite during the daytime passes (equatorial crossing at ~13 LT) on 21–23 June 2015: (a) variations of the topside VEC above the Swarm B satellite altitude of ~530 km as calculated from GPS receiver on board the satellite and (b) in situ electron density Ne as measured by the Langmuir Probe on board SWB. Color shows the amplitude of the VEC (Figure 2a), the Ne (Figure 2b), and the corresponding color scales are shown on the right side of the panels. Violet numbers on the top show satellite track number. Black arrow in the top left panel shows the direction of the satellite movement, ascending or descending; SAMI3/RCM model‐simulated VEC above (c) 530 km and the electron density Ne at the altitude of (d) 530 km for the time period 21–23 June 2015. The presented tracks are the SAMI3/RCM simulations for the time and longitude at the equatorial crossings of the SWB satellite presented in Figures 2a and 2b; (e) variations of the IMF Bz component (blue curve) and SYMH index (red curve) on 21–23 June 2015. The dates are shown on the top of the figure, and the universal time (UT, running from right to left) is shown on the bottom. Red arrows and vertical red dashed lines indicate the time of arrivals of the three IS. The coordinates are geographic.
Figure 3
Figure 3
The same as Figure 2 but with the deviations (a, c) dVEC and (b, d) dNe parameters from the quiet time levels. Figures 3a and 3b show the SWB observations, and Figures 3c and 3d show SAMI3/RCM simulation results for the altitude of the SWB satellite.
Figure 4
Figure 4
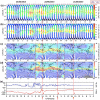
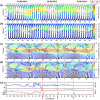
Ionospheric measurements by Swarm C (SWC) satellite during the daytime passes (equatorial crossing at ~11 LT) on 21–23 June 2015: (a) variations of the topside VEC above the SWC satellite altitude of ˜460 km as calculated from GPS receiver on board the satellite and (b) in situ electron density Ne as measured by the Langmuir probe on board SWC. Color shows the amplitude of the VEC (Figure 4a) and the Ne (Figure 4b), and the corresponding color scales are shown on the right side of the panels; SAMI3/RCM model‐simulated VEC above (c) 460 km and the electron density Ne at the altitude of (d) 460 km. The presented tracks are the SAMI3/RCM simulations for the time and longitude at the equatorial crossings of the SWC satellite presented in Figures 4a and 4b; (e) variations of the IMF Bz component (blue curve) and SYMH index (red curve). The dates are shown on the top of the figure, and the universal time (UT, running from right to left) is shown on the bottom. Red arrows and vertical red dashed lines indicate the time of arrivals of the three IS. The coordinates are geographic.
Figure 5
Figure 5
The same as Figure 4 but for the deviations (a, c) dVEC and (b, d) dNe parameters from the quiet time levels. Figures 5a and 5b show the SWC observations, and Figures 5c and 5d show the SAMI3/RCM simulation results at the altitude of SWC.
Figure 6
Figure 6
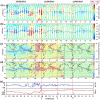
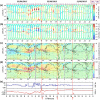
Ionospheric measurements by Swarm B (SWB) satellite during the nighttime passes (equatorial crossing at ~01 LT) on 21–23 June 2015: (a) variations of the ionospheric VEC above the Swarm B satellite altitude of ~530 km as calculated from GPS receiver on board the satellite and (b) in situ electron density Ne as measured by the Langmuir probe on board SWB. Color shows the amplitude of the VEC (Figure 6a) and the Ne (Figure 6b), and the corresponding color scales are shown on the right side of the panels. Violet numbers on the top show satellite track number. Black arrow in the top left panel shows the direction of the satellite movement, ascending or descending; SAMI3/RCM model‐simulated VEC above (c) 530 km and the electron density Ne at the altitude of (d) 530 km for the time period 21–23 June 2015. The presented tracks are the SAMI3/RCM simulations for the time and longitude at the equatorial crossings of the SWB satellite presented in Figures 6a and 6b; (e) variations of the IMF Bz component (blue curve) and SYMH index (red curve) on 21–23 June 2015. The dates are shown on the top of the figure, and the universal time (UT, running from right to left) is shown on the bottom. Red arrows and vertical red dashed lines indicate the time of arrivals of the three IS. The coordinates are geographic.
Figure 7
Figure 7
The same as Figure 4 but for the deviations (a, c) dVEC and (b, d) dNe parameters from the quiet time levels. Figures 7a and 7b show the SWB nighttime observations, and Figures 7c and 7d show the SAMI3/RCM simulation results.
Figure 8
Figure 8
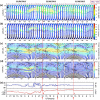
Ionospheric measurements by Swarm C (SWC) satellite during the nighttime passes (equatorial crossing at ~23 LT) on 21–23 June 2015: (a) variations of the topside VEC above the SWC satellite altitude of ~460 km as calculated from GPS receiver on board the satellite; (b) in situ electron density Ne as measured by the Langmuir probe on board SWC. Color shows the amplitude of the VEC (Figure 8a), the Ne (Figure 8b), and the corresponding color scales are shown on the right side of the panels; SAMI3/RCM model‐simulated VEC above (c) 460 km and the electron density Ne at the altitude of (d) 460 km. The presented tracks are the SAMI3/RCM simulations for the time and longitude at the equatorial crossings of the SWC satellite presented in Figures 8a and 8b; (e) variations of the IMF Bz component (blue curve) and SYMH index (red curve). The dates are shown on the top of the figure, and the universal time (UT, running from right to left) is shown on the bottom. Red arrows and vertical red dashed lines and labels 1, 2, and 3 indicate the time of arrivals of the three IS. The coordinates are geographic.
Figure 9
Figure 9
The same as Figure 4 but for the deviations (a, c) dVEC and (b, d) dNe parameters from the quiet time levels. Figures 9a and 9b show nighttime SWC observations, and Figures 9c and 9d show the SAMI3/RCM simulation results.
Figure 10
Figure 10
Scatterplots of Swarm B and C data versus SAMI3 simulation results at roughly the same location and time. (top row) For Swarm B at ~530 km and (bottom row) for Swarm C at ~460 km. The solid red line is based on the equation y = Mx, where M = Sy/Sx and Sy = mean (SAMI3/RCM Ne) and Sx = mean (Swarm Ne). The dashed red line is the linear least squares fit to the data.
Figure 11
Figure 11
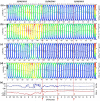
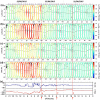
(a–d) Variations of the thermospheric neutral mass density (ρ) as derived from the GPS receivers on board Swarm spacecraft during 21–23 June 2015: (a, b) dayside measurements from SWB (at ~530 km, equatorial crossing at ~13 LT) and SWC (at ~460 km, equatorial crossing at ~11 LT) and (c, d) nightside measurements from SWB (~01 LT) and SWC (~23 LT), respectively. Black arrows on the left show the satellite movement direction, ascending and descending. The color scale is shown on the right; (e) variations of the IMF Bz component (blue curve) and SYMH index (red curve). The UT scale is shown on the bottom of the figure; time is running from right to left. Red vertical dashed lines show the arrival time of the three IS, as noted by “1,” “2,” and “3.” Gray vertical dotted lines show the 24 UT timelines, and the dates are shown on the top of the figure. Violet numbers on the top show satellite track numbers.
Figure 12
Figure 12
The same as Figure 11 but for the deviations dρ of the neutral mass density from quiet time values.

References

    1. Afraimovich, E. L. , Astafyeva, E. I. , Demyanov, V. V. , Edemskiy, I. K. , Gavrilyuk, N. S. , Ishin, A. B. , … Zhivetiev, I. V. (2013). A review of GPS/GLONASS studies of the ionospheric response to natural and anthropogenic processes and phenomena. Journal of Space Weather and Space Climate, 3, A27 https://doi.org/10.1051/swsc2013049 - DOI
    1. Afraimovich, E. L. , Astafyeva, E. I. , Kosogorov, E. A. , & Yasyukevich, Y. V. (2011). The mid‐latitude field‐aligned disturbances and their effects on differential GPS and VLBI. Advances in Space Research, 47(10), 1804–1813. https://doi.org/10.1016/j.asr.2010.06.030 - DOI
    1. Astafyeva, E. , Yasukevich, Y. , Maksikov, A. , & Zhivetiev, I. (2014). Geomagnetic storms, super‐storms and their impact on GPS‐based navigation. Space Weather, 12, 508–525, https://doi.org/10.1002/SW001072 - DOI
    1. Astafyeva, E. , Zakharenkova, I. , & Alken, P. (2016). Prompt penetration electric fields and the extreme topside ionospheric response to the 22–23 June 2015 geomagnetic storm as seen by the Swarm constellation. Earth, Planets and Space, 68(1), 152 https://doi.org/10.1186/s40623-016-0526-x - DOI
    1. Astafyeva, E. , Zakharenkova, I. , & Doornbos, E. (2015). Opposite hemispheric asymmetries during the ionospheric storm of 29–31 August 2004. Journal of Geophysical Research, 120(1), 697–714. https://doi.org/10.1002/2014JA020710 - DOI

LinkOut - more resources