. 2018 Mar 10;5(6):1700625.
doi: 10.1002/advs.201700625. eCollection 2018 Jun.

Nanofabricated Ultraflexible Electrode Arrays for High-Density Intracortical Recording

Affiliations

Nanofabricated Ultraflexible Electrode Arrays for High-Density Intracortical Recording

Xiaoling Wei et al. Adv Sci (Weinh). .

Abstract

Understanding brain functions at the circuit level requires time-resolved simultaneous measurement of a large number of densely distributed neurons, which remains a great challenge for current neural technologies. In particular, penetrating neural electrodes allow for recording from individual neurons at high temporal resolution, but often have larger dimensions than the biological matrix, which induces significant damage to brain tissues and therefore precludes the high implant density that is necessary for mapping large neuronal populations with full coverage. Here, it is demonstrated that nanofabricated ultraflexible electrode arrays with cross-sectional areas as small as sub-10 µm2 can overcome this physical limitation. In a mouse model, it is shown that these electrodes record action potentials with high signal-to-noise ratio; their dense arrays allow spatial oversampling; and their multiprobe implantation allows for interprobe spacing at 60 µm without eliciting chronic neuronal degeneration. These results present the possibility of minimizing tissue displacement by implanted ultraflexible electrodes for scalable, high-density electrophysiological recording that is capable of complete neuronal circuitry mapping over chronic time scales.

Keywords: electron‐beam lithography; flexible neural electrodes; high‐density intracortical recording; in vivo extracellular recording; nanofabrication.


Figures

Figure 1
Figure 1
As‐fabricated NET‐e devices. a–c) Photographs of the EBL section of a variety of NET‐e devices, including a) linear array NET‐e‐l, b) oversampling array NET‐e‐o, and c) tetrode‐like array NET‐e‐t. d–f) Zoom‐in images of panels (a)–(c) as marked by the dashed boxes, showing the fine structure and precise interlayer alignment. g) Sketch of the two multilayer architecture of the NET‐e devices. h) Scanning electron microscopy (SEM) image (top) and height profile by atomic force microscopy (AFM, bottom) of an NET‐e‐t electrode showing the sub‐micrometer thickness and fine layered structures at the cross section. Dashed line marks the position of the AFM height measurement. Scale bars: 50 µm, panels (a)–(c); 10 µm, panels (d–f); and 5 µm, panel (h).
Figure 2
Figure 2
Implantation of the NET‐e devices. a–e) Photograph of NET‐e devices immersed in water: a) overview of an NET‐e device including the carrier chip and a connector to external I/O mounted atop; b) the e‐beam section of four threads on panel (a) showing the ultraflexibility; c–e) electrodes on c) NET‐e‐l, d) NET‐e‐t, and e) NET‐e‐o. f) Pseudocolor SEM image of an NET‐e‐l device (in purple and gold) attached on a shuttle device made of carbon fiber (purple) with a diameter of 7 µm, showing the small dimension of both. g) Zoom‐in view in panel (f). h) Photograph showing an NET‐e‐o probe successfully delivered into living mouse brain. Arrows denote the delivery entry sites. Dashed lines mark the probe implanted beneath the brain surface. Image was taken 20 d post implantation through a cranial optical window. i) Photograph of a mouse immediately after NET‐e probe implantation. Gently pulling the carrier chip straightened the relaxed section of the probe without pulling out the implanted section. j) Photograph of a head‐constrained mouse on a custom‐built treadmill for awake recording. Scale bars: 2 mm, panel (a); 200 µm, panels (b,h); 20 µm, panels (c–f); and 10 µm, panel (g).
Figure 3
Figure 3
In vivo recording performance of NET‐e devices. a) In vivo impedance at 1 kHz measured at 1week after implantation, n = 20 for each dimension. Dashed box: impedance of electrodes with PEDOT coating (n = 6) measured in 1 × PBS. b) In vivo noise level of the smallest electrode (5 µm × 8 µm) at anesthetized (right, 6.46 µV median) and awake (left, 11.4 µV median) measurements (bandwidth: 0.5 Hz to 7.5 kHz), n = 20. Measurement time: 5 weeks after implantation. c–f) SNR of action potential recordings by NET‐e probes (n = 10 electrode sites of three NET‐e‐l probes in three anesthetized mice) over c) 8 weeks and representative recordings from three implanted NET‐e‐l electrodes in an anesthetized mouse d) 2 weeks and e,f) 5 weeks after implantation. Left: 1s real‐time recording trace; 250 Hz high‐pass filter applied. Right: Superimposed spikes isolated from the recording traces. All unit events were plotted in light gray and averaged waveforms plotted in red and blue. SNR was calculated using the larger waveform when there were two recorded on one electrode. Vertical scale bars: 50 µV, panels (c–e); horizontal scale bars: 0.1 s, panels (c–e, left) and 0.25 ms (c–e, right). The symbols * and ** in panels (a,b) denote significant difference of p < 0.01 and p < 0.001 between the groups, respectively.
Figure 4
Figure 4
Representative unit recording from NET‐e electrodes. a) Schematic showing the relative position of electrodes on NET‐e‐l (left) and NET‐e‐t (right) devices in the brain. b) Recording time trace from an NET‐e‐l probe hosting a linear electrode array. Inset sketches the NET‐e‐l probe. c) 10 ms recording trace from panel (b) on the top four electrodes highlighting a single spike that was picked up by adjacent electrodes with attenuated amplitudes. Same color code as panel (b). b,c) The recording was performed 5 weeks after implantation. d) Recording time trace from a group of four NET‐e‐t electrodes showing correlated spikes. Inset sketches the NET‐e‐t probe. e) Sorted single‐unit waveforms from panel (d). d,e)The recording was performed 9 weeks after implantation. f) Superimposed spikes isolated from the same NET‐e‐l electrode over 8 weeks post implantation. Averaged waveforms shown in red. Vertical scale bars: 50 µV, panels (b–f); horizontal scale bars: 0.1 s, panels (b) and (d); 2 ms, panel (c); and 0.5 ms, panels (e,f).
Figure 5
Figure 5
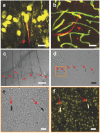
In vivo and postmortem tissue–probe interface. a) Reconstruction of in vivo 2P images of neurons (yellow, Thy1‐YFP) surrounding an NET‐e‐l probe (red) 2 months post implantation. Image stack: 100–320 µm below the brain surface. b) 3D reconstruction of vasculature by in vivo 2P microscopy around NET‐e‐l probe (red) 2 months postimplantation, showing normal capillary networks (green). Image stack: 100–320 µm below the brain surface. c) Photograph showing in vivo implantation of multiple NET‐e‐l probes. Arrows denote the implantation locations. d) Bright field image of a postmortem tissue slice at the probe–tissue interface as shown in panel (c) 4 months postimplantation. Arrows denote the probes. e) Zoom‐in bright field image of the boxed region shown in panel (d). Arrows denote the probes. f) Fluorescence image of the same area as in panel (e). Color code: yellow, NeuN, labelling neuron nuclei; Rhodamine 6G, labelling NET‐e probe. Normal neuronal density was observed near the two probes at inter‐probe distance was 60 µm. Scale bars: 50 µm, panels (a–d); 10 µm, panels (e,f).

Similar articles

Cited by

References

    1. Kotov N. A., Winter J. O., Clements I. P., Jan E., Timko B. P., Campidelli S., Pathak S., Mazzatenta A., Lieber C. M., Prato M., Bellamkonda R. V., Silva G. A., Kam N. W. S., Patolsky F., Ballerini L., Adv. Mater. 2009, 21, 3970.
    1. Fattahi P., Yang G., Kim G., Abidian M. R., Adv. Mater. 2014, 26, 1846. - PMC - PubMed
    1. Nicolelis M. A., Ghazanfar A. A., Faggin B. M., Votaw S., Oliveira L. M., Neuron 1997, 18, 529. - PubMed
    1. Gray C. M., Maldonado P. E., Wilson M., McNaughton B., J. Neurosci. Methods 1995, 63, 43. - PubMed
    1. Wise K. D., Angell J. B., Starr A., IEEE Trans. Biomed. Eng. 1970, 17, 238. - PubMed

LinkOut - more resources