. 2018 Oct;36(10):1603-1616.
doi: 10.1002/stem.2868. Epub 2018 Jul 29.

Runx1 Role in Epithelial and Cancer Cell Proliferation Implicates Lipid Metabolism and Scd1 and Soat1 Activity

Affiliations

Runx1 Role in Epithelial and Cancer Cell Proliferation Implicates Lipid Metabolism and Scd1 and Soat1 Activity

Prachi Jain et al. Stem Cells. 2018 Oct.

Abstract

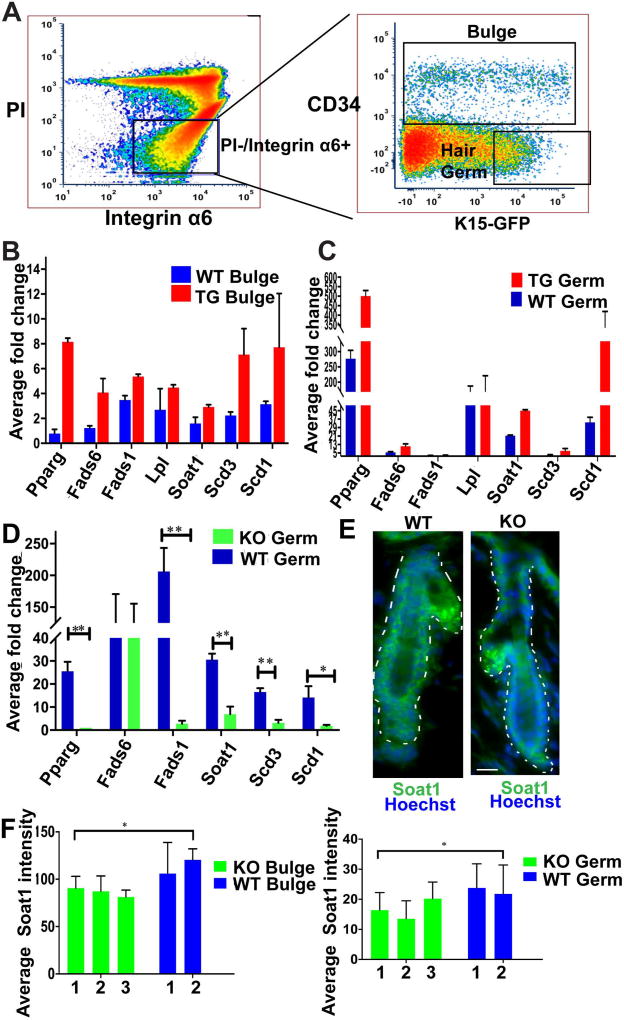
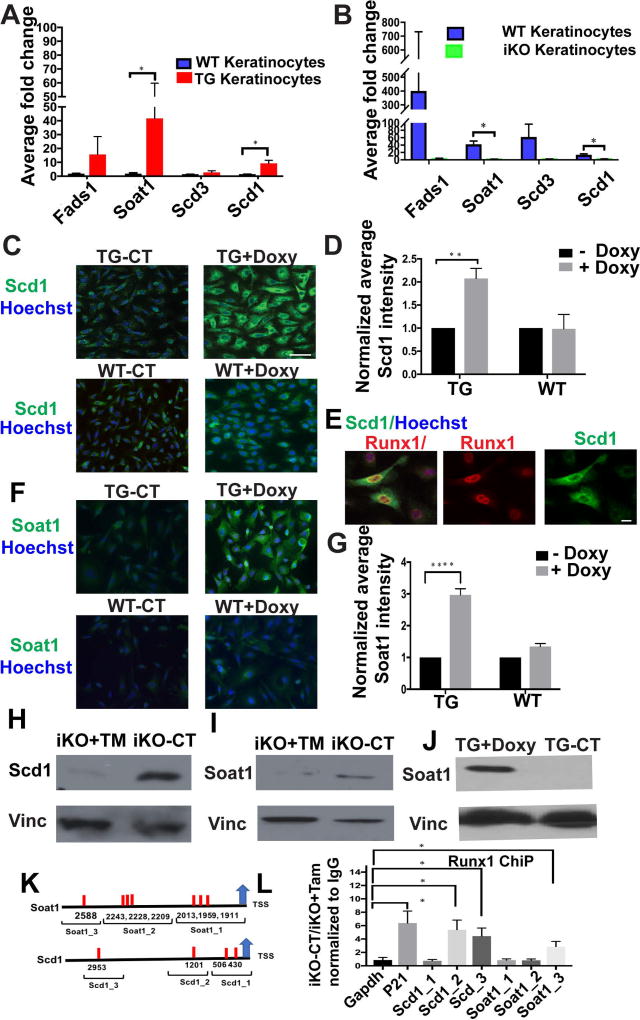
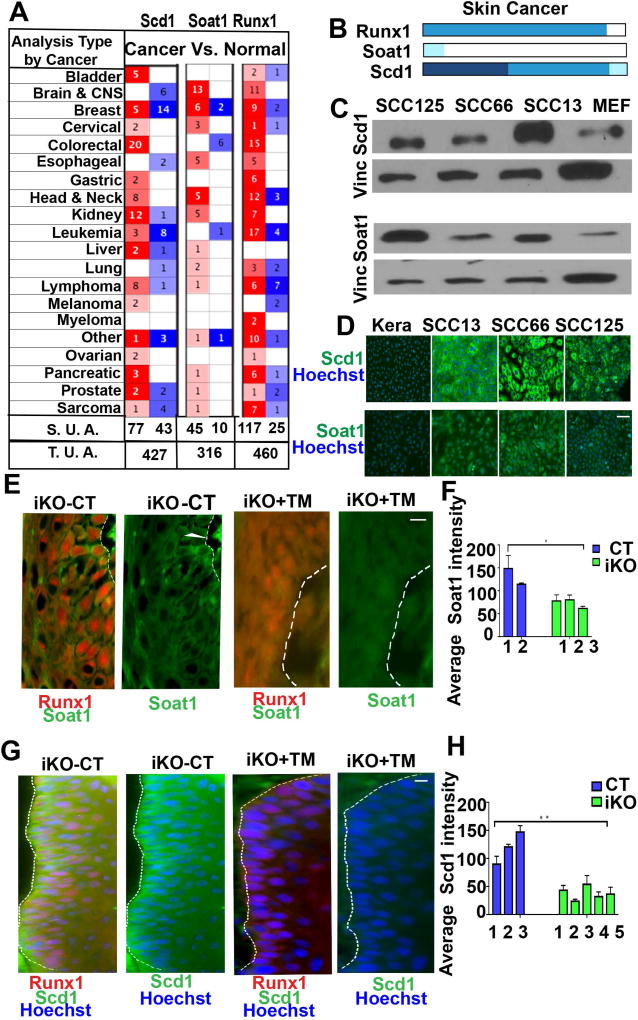
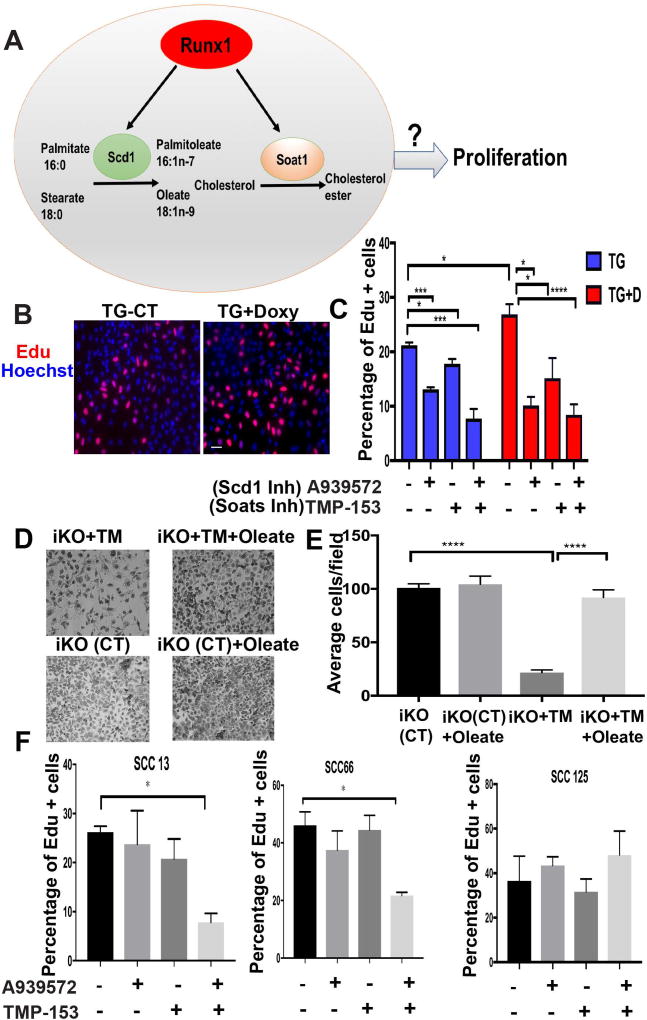
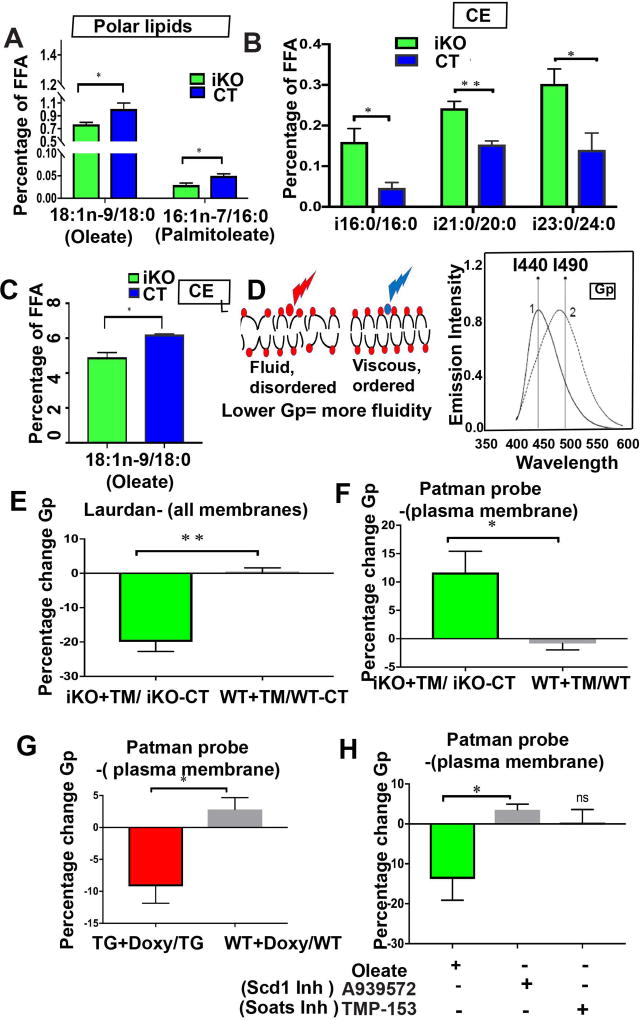
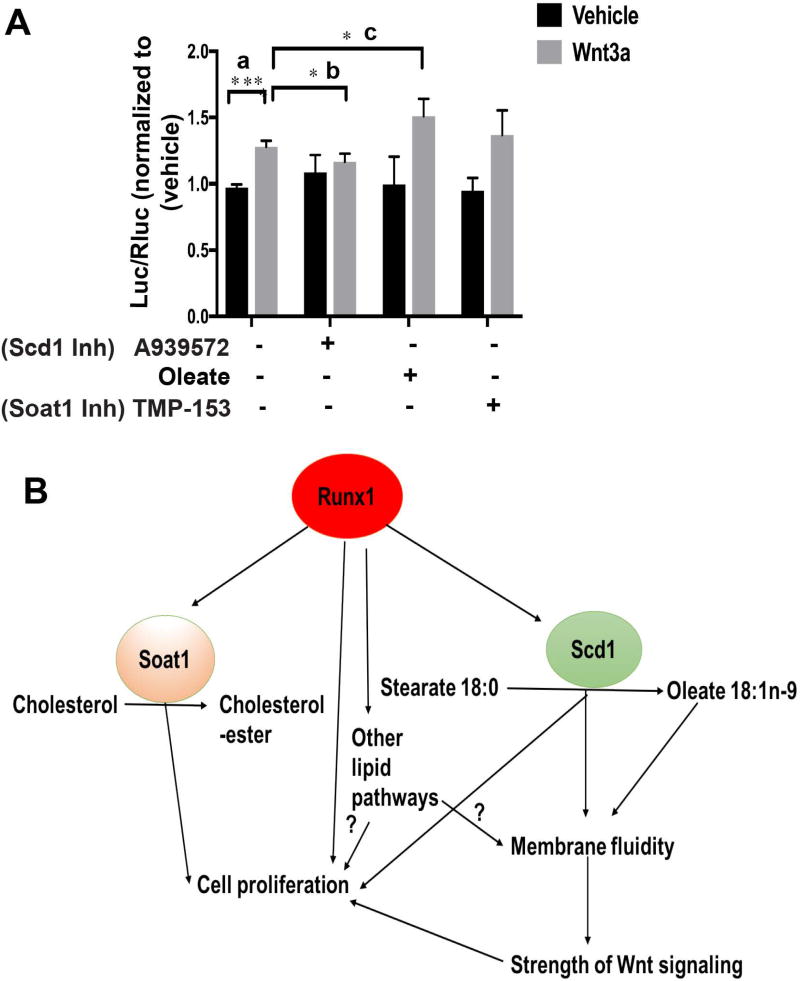
The role of lipid metabolism in epithelial stem cell (SC) function and carcinogenesis is poorly understood. The transcription factor Runx1 is known to regulate proliferation in mouse epithelial hair follicle (HF) SCs in vivo and in several mouse and human epithelial cancers. We found a novel subset of in vivo Runx1 HFSC target genes related to lipid metabolism and demonstrated changes in distinct classes of lipids driven by Runx1. Inhibition of lipid-enzymes Scd1 and Soat1 activity synergistically reduces proliferation of mouse skin epithelial cells and of human skin and oral squamous cell carcinoma cultured lines. Varying Runx1 levels induces changes in skin monounsaturated fatty acids (e.g., oleate, a product of Scd1) as shown by our lipidome analysis. Furthermore, varying Runx1 levels, the inhibition of Scd1, or the addition of Scd1-product oleate, individually affects the plasma membrane organization (or fluidity) in mouse keratinocytes. These factors also affect the strength of signal transduction through the membranes for Wnt, a pathway that promotes epithelial (cancer) cell proliferation and HFSC activation. Our working model is that HFSC factor Runx1 modulates the fatty acid production, which affects membrane organization, facilitating signal transduction for rapid proliferation of normal and cancer epithelial cells. Stem Cells 2018;36:1603-1616.

Keywords: Adult stem cells; Cancer; Cellular proliferation; Epidermis; Signal transduction; fluorescence-activated cell sorter.


Conflict of interest statement

Disclosure of Potential Conflicts of Interest :

Authors declare no conflict of interests.

Figures

Figure 1
Figure 1. Expression of lipid metabolism genes in mouse skin
(A) Representative FACS dot plot shows sorting gates to isolate bulge (CD34+/α6 integrin+/GFP+/−) and hair germ (HG) early progenitor cells as (CD34−/α6+/GFP+), as previously characterized (1). The brightest 1/3 of the GFP+ cells were used, to avoid potential cross-contamination between bulge and hair germ populations (1). (B) qRT-PCR from Runx1 inducible transgenic (TG) FACS sorted bulge cells shows an increase in expression of lipid metabolism genes as compare to WT littermates. (n=2 mice from each genotype). (C) qRT-PCR from Runx1 inducible transgenic (TG) FACS sorted hair germ (HG) cells shows an increase in expression of lipid metabolism genes as compare to WT littermates. (n=2 mice from each genotype). (D) qRT-PCR from Runx1 inducible knockout (iKO) FACS sorted HG cells shows a decrease in expression of lipid metabolism genes as compare to WT littermates. (n=3 mice from each genotype, P value throughout all figures that are <0.05 is represented as “*” on the graph and p value <0.005 represented as “**”. (E) Immunofluorescence staining shows expression of Soat1 (green), Hoechst (blue) in HG and bulge is reduced in the Runx1 KO. Scale bar, 20 µm. (F) Quantification of Soat1 expression in bulge and HG shows significant decrease upon Runx1 knockout. Numbers at bottom indicate individual mouse ID. (n=40 hair follicles per genotype).
Figure 2
Figure 2. Runx1 dictate the expression of Scd1 and Soat1 in cultured keratinocytes
(A, B) qRT-PCR validation of mRNA levels for candidate genes in cultured Runx1 inducible knockout (iKO) following 48 hours of 4-OHT and transgenic (TG) keratinocytes following 6 hours of doxycycline relative to WT controls. (n=3 from each represented genotype). Significant p values (<0.05) are shown as *. (C, F) Immunofluorescence staining of cultured keratinocytes shows expression of Scd1 or Soat1 (green) in response to doxycycline (doxy)-induced Runx1 (TG+Doxy), TG control with no doxy (TG-CT), and WT cells without doxy (WT-CT) ad with doxy (WT+Doxy). Scale bar, 20 µm. (D, G) Quantification of average Scd1 or Soat1 staining after Runx1 induction (TG+Doxy) when compared with control (TG-CT) and (WT+ Doxy) when compared with no doxy control (WT-CT). (n=3 experiments, ~ 150–200 cells per experiment); normalized against control in each group, average intensity is arbitrary value. P value that are <0.05 is represented as “*” on the graph and P value <0.0001 represented as “****”. (E) Immunofluorescence staining showing correlation of doxy-induced Runx1 elevation (red) with enhanced Scd1 expression (green). Nuclei (blue) were counterstained with Hoechst. Scale bar, 20 µm. (H, I) Western blotting showing a decrease of Soat1 and Scd1 protein levels in cultured keratinocytes of Runx1 iKO after 48 hours of 4-OHT treatment, denoted as (TM). Vinculin (Vinc) works as loading control. (J) Western blotting against vinculin (Vinc) or Soat1 antibodies showing an increase of Soat1 protein in Runx1 TG keratinocytes after 12 hours of doxy-induced Runx1 expression. (K) Scheme representing ChIP probed regions to cover predicted Runx1 binding sites (red bar) the promoters of Scd1 and Soat1. (L) ChIP of CT (iKO-CT) and Runx1 KO (iKO+Tam) keratinocytes using Runx1 antibody, P value for pair wise comparisons that are <0.05 is represented as “*” on the graph, (n= 3 independent experiments).
Figure 3
Figure 3. Expression of Scd1 & Soat1 in Squamous Cell Carcinomas
(A) Table showing the number of significant unique analyses (S. U. A.) and total unique analyses (T. U. A.) using Oncomine data sets curated for cancer versus normal tissue pointing to up (red) or down (blue) regulation of Runx1, Scd1, and Soat1 in a variety of cancers. Number in each cell corresponds to number of analysis that meets the threshold of top 10% of all overrepresented genes in tumors. (B) Human Protein Atlas analyses showing expression profiles of Runx1, Soat1 and Scd1 in skin cancer which comprises tumors samples of squamous cell carcinoma and basal cell carcinoma. Runx1 is expressed in most skin cancer tumors, Soat1 shows low expression, while Scd1 shows moderate to high expression. Darker shades of blue correspond to higher expression. (C) Western blotting of skin carcinoma (SCC13) and oral carcinomas (SCC66, SCC125) cell lines show elevated levels of Scd1 and Soat1 as compare to mouse embryonic feeders (MEFs) used as controls. Vinculin (Vinc) served as the loading control. Shown is one representative example of 3 independent experiments. (For quantification of data in C&D in repeat experiments see Supplementary Fig. 3) (D) Immunofluorescence staining of skin squamous cell carcinoma (SCC13) and oral squamous cell carcinomas (SCC66, SCC125) showing Scd1 (green) and Soat1 (green). Note striking Scd1 and Soat1 up-regulation in SCCs as compare to wild type (WT) mouse keratinocytes. Scale bar, 20 µm. (E–H) Immunofluorescence staining (E, G) and quantifications (F, H) of mouse skin tumors show that Scd1 (green) and Soat1 (green) are highly expressed in WT tumors and are down-regulated in iKO tumors upon loss of Runx1. White line delineates epithelial cell clusters where Scd1 is expressed. Numbers represent tumors derived from different mice. Scale bar, 20 µm. P value that are <0.05 is represented as “*” and P value <0.005 represented as “**” on the graph.
Figure 4
Figure 4. Scd1 and Soat1 activity affects epithelial cell proliferation
(A) Scheme proposing Runx1 mediated pathway to regulate epithelial cell proliferation. (B) Representatives images of Edu staining (red) to show effect of Runx1 on proliferation of keratinocytes. Runx1 is overexpressed after addition of doxycycline to TG cells (TG+Doxy); TG cells alone serves as a control (TG-CT). (C) Quantification of percentage of proliferating cells with or without treatment of chemical inhibitors A939572 or TMP-153 to TG and TG+Doxy cells. (n=3, average 500 cells per sample were counted). P value that are <0.05 is represented as “*”, P value <0.005 represented as “**”, and P value <0.0001 represented as “**** ”. (D) Representative images of Tamoxifen (TM)-induced Runx1 iKO keratinocytes with or without addition of Oleate, after 4 days of plating. (Also see Supplementary Figure 3) (n=2 different cell lines of represented genotype). (E) Quantification of number of cells per field of Tamoxifen (TM)-induced Runx1 KO keratinocytes with or without addition of Oleate after 4 days of plating. P value that are <0.0001 represented as “****”. (F) Quantification of percentage of proliferating cells (EdU+) with or without treatment of chemical inhibitors A939572 or TMP-153 to human SCC cells. Note that co-inhibiting Scd1 and Soat1 results in a synergistic decrease on Edu+ cell number of SCC 13 and SCC 66 cell lines. Significant P value that are <0.05 is represented as “*” on the graph.
Figure 5
Figure 5. Runx1 levels impact lipid content and membrane organization
(A–C) Data from lipidome analysis of total skin show changes upon Runx1 loss. P value that are <0.05 is represented as “*” and P value <0.005 represented as “**”: (A) ratios of Scd1 products (oleate and palmitoleate) and substrates (stearate and palmitate, respectively) change in the polar lipids category. (B) (C) Ratio of products and substrates in cholesterol ester (CE) lipid fraction with or without Runx1 loss. (B) Branched chain fatty acid iso (i)-16:0, i21, i23 increase significantly in response to Runx1 loss. (C) Oleate (Scd1 product) decreases in response to Runx1 loss. (n=3 CT mice and n=5 Runx1 iKO mice were used for lipidome analysis). (D) Cartoon showing fluid or disordered state of membrane (left) due to unsaturated fatty acids versus viscous or ordered state of membrane (right). Laurdan is a membrane-intercalating fluorescent probe that shifts emission in the phospholipid bilayer of membranes from red (490 nm) in the membrane-disordered state to blue (440 nm) in the membrane-ordered state, as shown in the left cartoon and in the emission spectrum on the right. Fatty acid composition of membrane affects membrane organization or fluidity, which can be measured as a function of generalized polarization (Gp), using probes such as Laurdan and Patman. (E) Membrane fluidity using Laurdan, which binds to all membrane, indicates decreased Gp value in the Runx1 iKO, which translates in more overall membrane fluidity. P value <0.005 represented as “**”: (F–G) Membrane fluidity assays using Patman probe, which binds specifically to the plasma membrane. Note Runx1 elevation leads to decreased Gp (e.g. more membrane fluidity) and Runx1 knockout leads to increased Gp (e.g. less membrane fluidity). P value that are <0.05 is represented as “*” on the graph. (H) Membrane fluidity assay using Patman probe indicates that fluidity can be altered by feeding cells with Oleate or A939572 but not TMP-153. (n>= 3 for E–G). P value that are <0.05 is represented as “*” on the graph.
Figure 6
Figure 6. Scd1 activity affects Wnt signaling
(A) Strength of Wnt signaling is measured by TOPflash assay, as described (2) upon treatment with inhibitors A939572, TMP-153 or Oleate for 16 hours followed by the addition of Wnt3a for 24 hours. (n=4 for each represented treatments). Y axis, Luc/Rluc. ratio of luciferase (Luc) units over Renilla luciferase (RLuc) in inhibitor-treated groups is normalized to vehicle. P value for pairwise comparisons a, b, c is represented on the graph. P value <0.0001 represented as “****” and P value that are <0.05 is represented as “*”. (B) Model: Runx1 modulates levels of Scd1 and Soat1 and its products oleate and cholesterol esters to regulate proliferation in part through membrane organization (or fluidity). Scd1 activity and oleate concentration in the plasma membrane phospholipids in turn alters Wnt activity resulting in higher responsiveness to signals and enhanced cell proliferation.

Similar articles

Cited by

References

    1. Ryan RO, van der Horst DJ. Lipid transport biochemistry and its role in energy production. Annu Rev Entomol. 2000;45:233–260. - PubMed
    1. Hamilton LK, Fernandes KJL. Neural stem cells and adult brain fatty acid metabolism: Lessons from the 3xTg model of Alzheimer's disease. Biol Cell. 2017 - PubMed
    1. Sakayori N, Kimura R, Osumi N. Impact of lipid nutrition on neural stem/progenitor cells. Stem Cells Int. 2013;2013:973508. - PMC - PubMed
    1. Li J, Tang Y, Cai D. IKKbeta/NF-kappaB disrupts adult hypothalamic neural stem cells to mediate a neurodegenerative mechanism of dietary obesity and pre-diabetes. Nat Cell Biol. 2012;14:999–1012. - PMC - PubMed
    1. Beyaz S, Mana MD, Roper J, et al. High-fat diet enhances stemness and tumorigenicity of intestinal progenitors. Nature. 2016;531:53–58. - PMC - PubMed

Publication types

MeSH terms