

Engineered nanoparticles interact with nutrients to intensify eutrophication in a wetland ecosystem experiment
- PMID: 29939451
- PMCID: PMC6635952
- DOI: 10.1002/eap.1742
Engineered nanoparticles interact with nutrients to intensify eutrophication in a wetland ecosystem experiment
Abstract
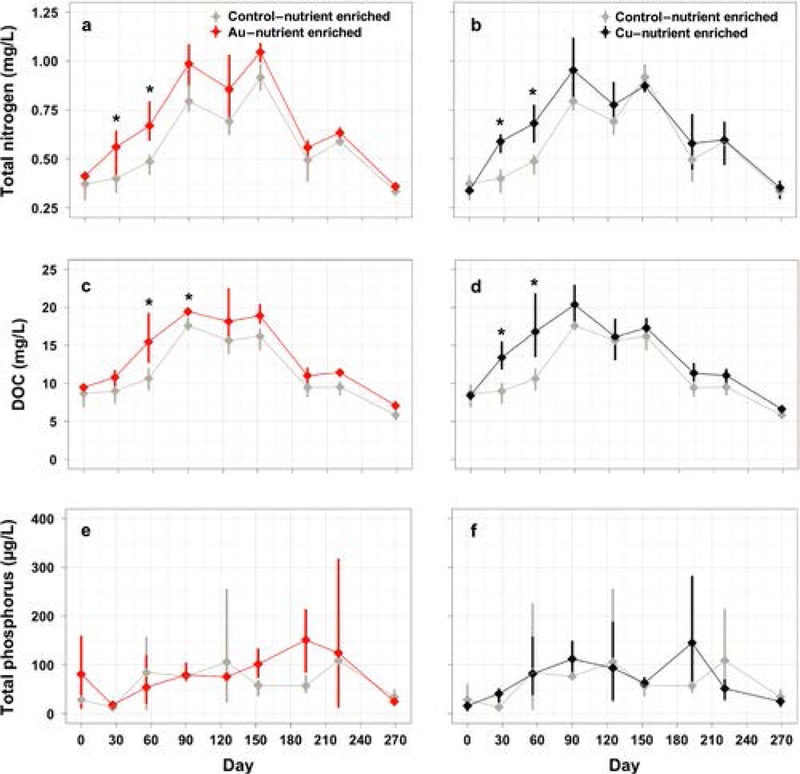
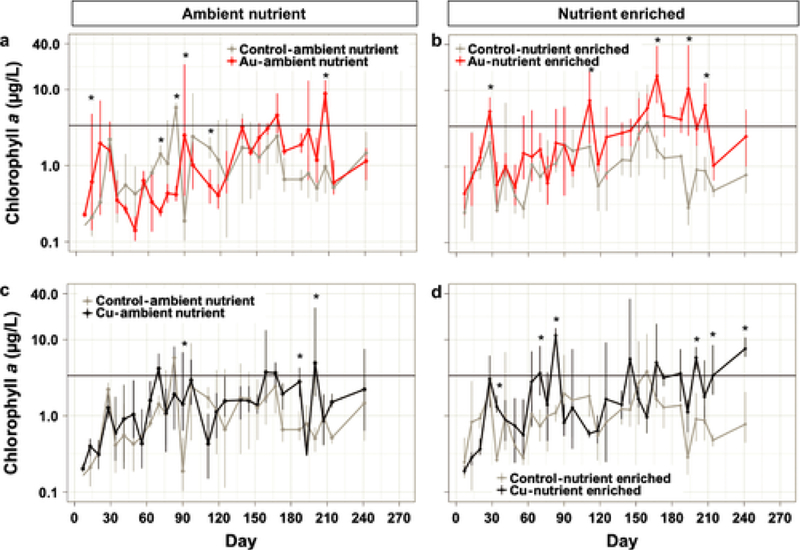
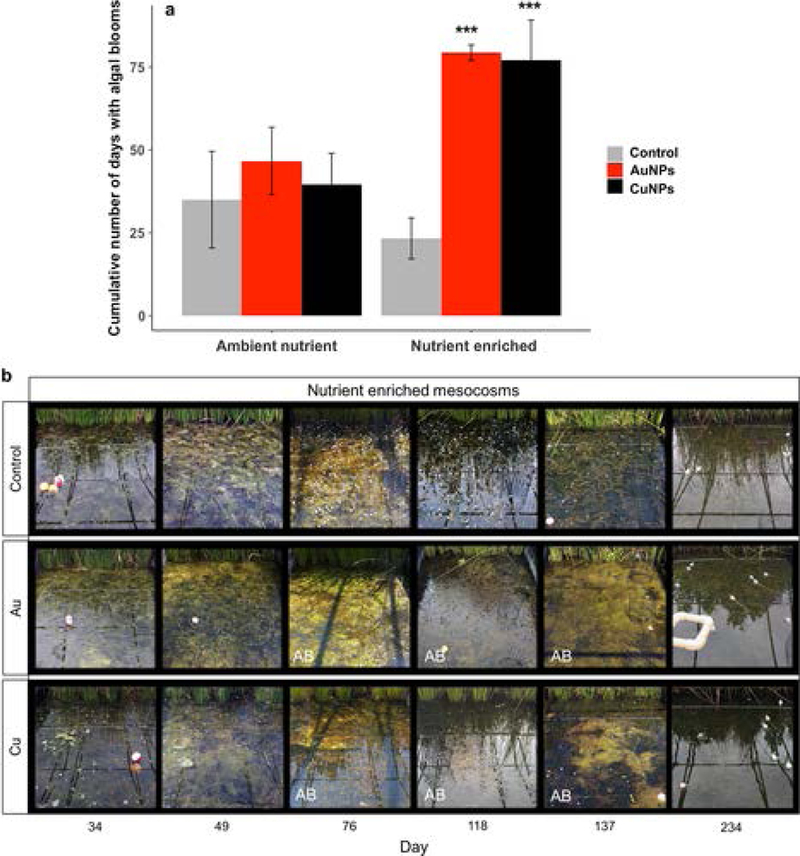
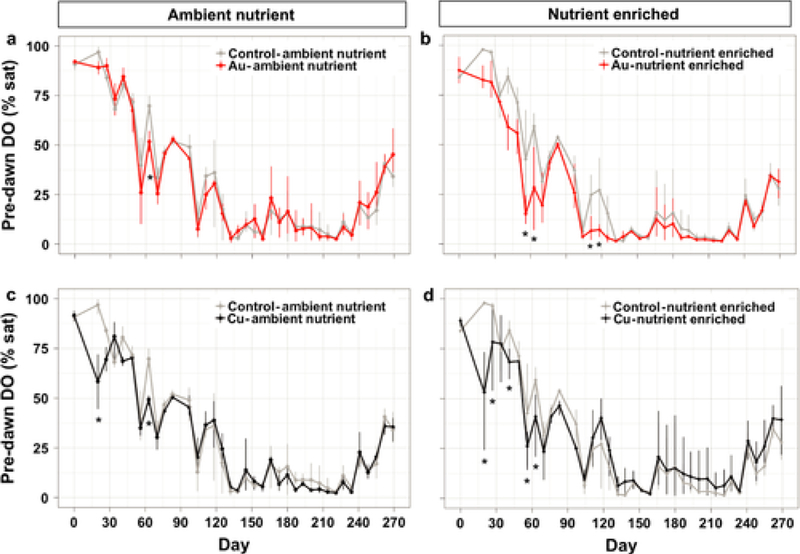
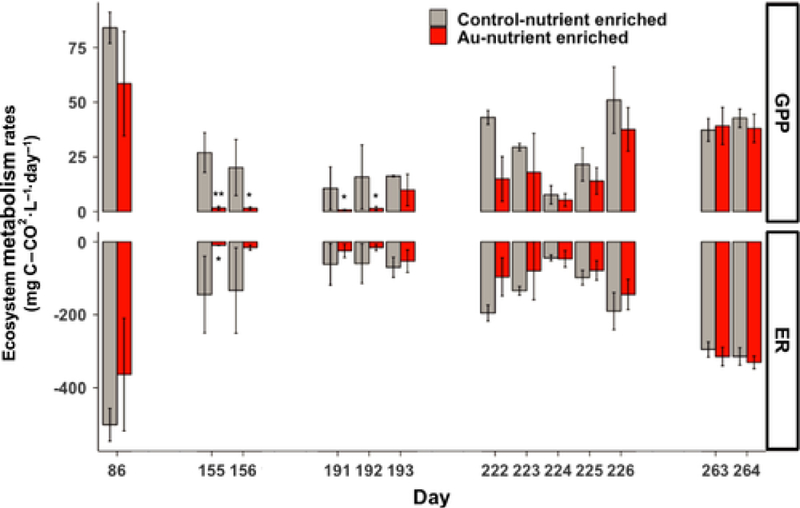
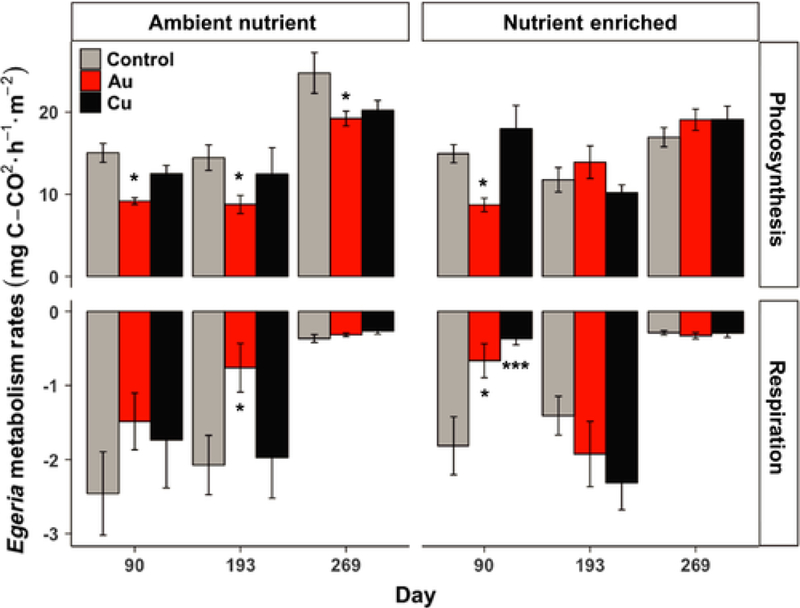
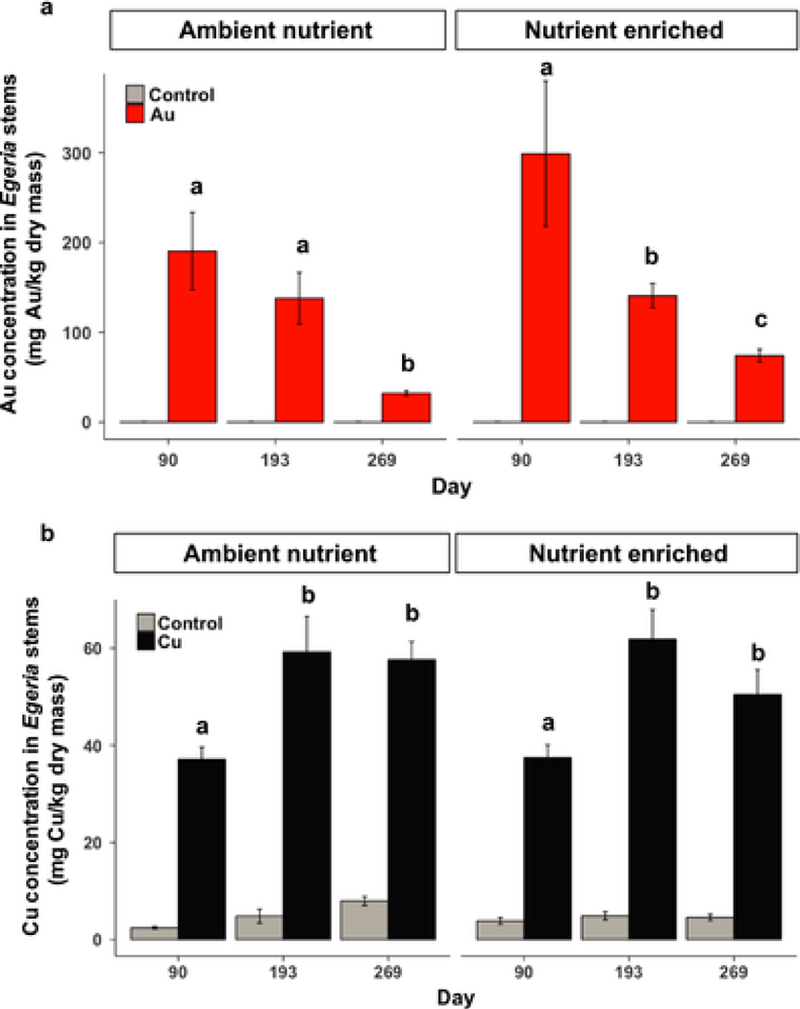
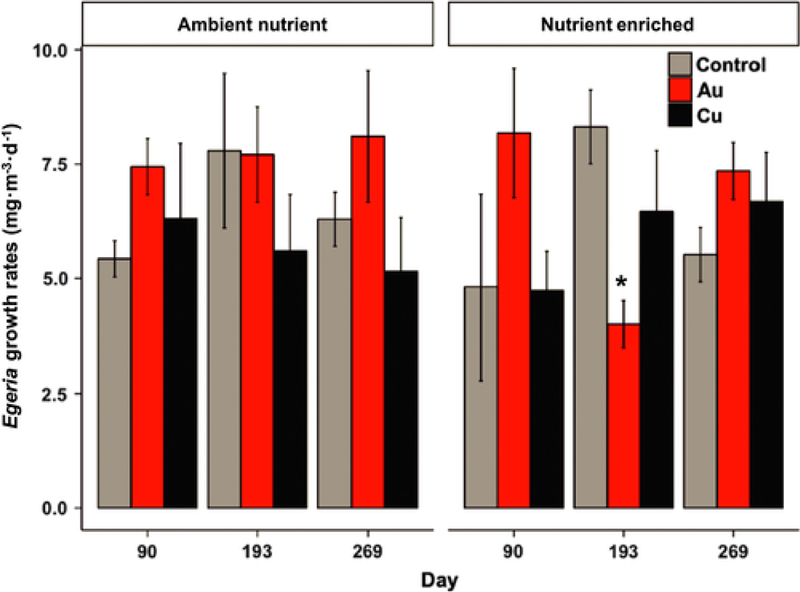
Despite the rapid rise in diversity and quantities of engineered nanomaterials produced, the impacts of these emerging contaminants on the structure and function of ecosystems have received little attention from ecologists. Moreover, little is known about how manufactured nanomaterials may interact with nutrient pollution in altering ecosystem productivity, despite the recognition that eutrophication is the primary water quality issue in freshwater ecosystems worldwide. In this study, we asked two main questions: (1) To what extent do manufactured nanoparticles affect the biomass and productivity of primary producers in wetland ecosystems? (2) How are these impacts mediated by nutrient pollution? To address these questions, we examined the impacts of a citrate-coated gold nanoparticle (AuNPs) and of a commercial pesticide containing Cu(OH)2 nanoparticles (CuNPs) on aquatic primary producers under both ambient and enriched nutrient conditions. Wetland mesocosms were exposed repeatedly with low concentrations of nanoparticles and nutrients over the course of a 9-month experiment in an effort to replicate realistic field exposure scenarios. In the absence of nutrient enrichment, there were no persistent effects of AuNPs or CuNPs on primary producers or ecosystem productivity. However, when combined with nutrient enrichment, both NPs intensified eutrophication. When either of these NPs were added in combination with nutrients, algal blooms persisted for >50 d longer than in the nutrient-only treatment. In the AuNP treatment, this shift from clear waters to turbid waters led to large declines in both macrophyte growth and rates of ecosystem gross primary productivity (average reduction of 52% ± 6% and 92% ± 5%, respectively) during the summer. Our results suggest that nutrient status greatly influences the ecosystem-scale impact of two emerging contaminants and that synthetic chemicals may be playing an under-appreciated role in the global trends of increasing eutrophication. We provide evidence here that chronic exposure to Au and Cu(OH)2 nanoparticles at low concentrations can intensify eutrophication of wetlands and promote the occurrence of algal blooms.
Keywords: Egeria; algae; algal bloom; aquatic ecosystems; copper nanoparticles; eutrophication; gold nanoparticles; macrophytes; multiple stressors; nanomaterial; nutrients.
© 2018 by the Ecological Society of America.
Figures
References
-
- Aristi I, Casellas M, Elosegi A, Insa S, Petrovic M, Sabater S, and Acuña V. 2016. Nutrients versus emerging contaminants–Or a dynamic match between subsidy and stress effects on stream biofilms. Environmental Pollution 212:208–215. - PubMed
-
- Barrena R, Casals E, Colón J, Font X, Sánchez A, and Puntes V. 2009. Evaluation of the ecotoxicity of model nanoparticles. Chemosphere 75:850–857. - PubMed
-
- Berglund O 2003. Periphyton density influences organochlorine accumulation in rivers. Limnology and Oceanography 48:2106–2116
-
- Bernhardt ES, Rosi EJ, and Gessner MO. 2017. Synthetic chemicals as agents of global change. Frontiers in Ecology and the Environment 15:84–90.
-
- Bone AJ, Colman BP, Gondikas AP, Newton KM, Harrold KH, Cory RM, Unrine JM, Klaine SJ, Matson CW, and Di Giulio RT. 2012. Biotic and Abiotic Interactions in Aquatic Microcosms Determine Fate and Toxicity of Ag Nanoparticles:Part 2–Toxicity and Ag Speciation. Environmental Science & Technology 46:6925–6933. - PubMed
Publication types
MeSH terms
Substances
Grants and funding
LinkOut - more resources
Full Text Sources
Other Literature Sources
