

Redox Engineering of Cytochrome c using DNA Nanostructure-Based Charged Encapsulation and Spatial Control
- PMID: 29939710
- PMCID: PMC6325017
- DOI: 10.1021/acsami.8b07101
Redox Engineering of Cytochrome c using DNA Nanostructure-Based Charged Encapsulation and Spatial Control
Abstract
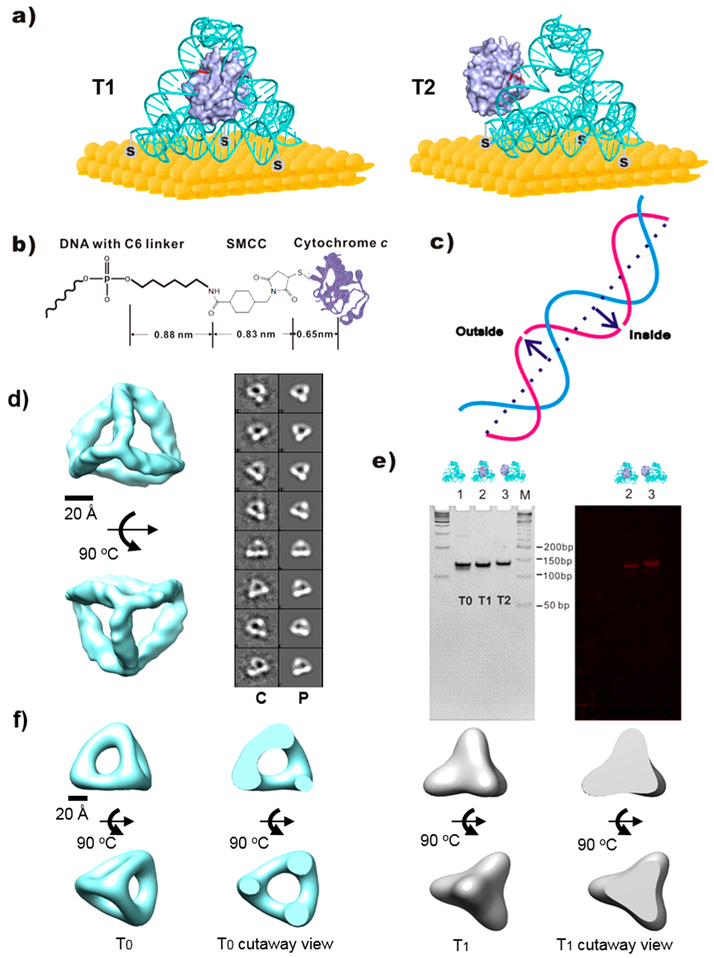
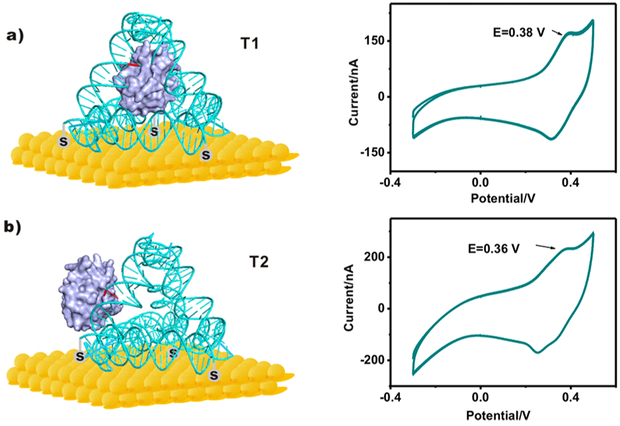
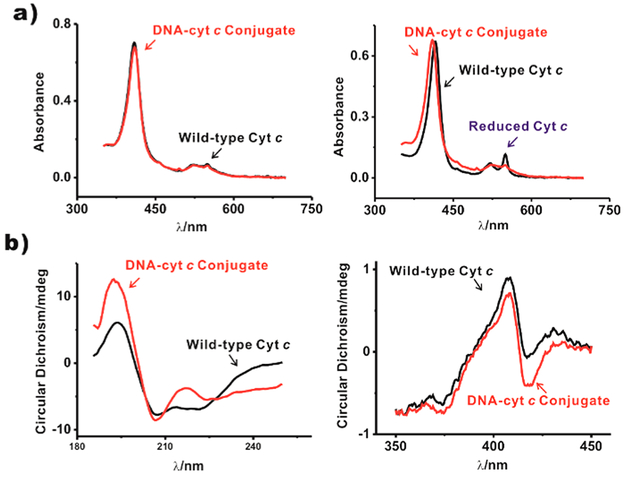
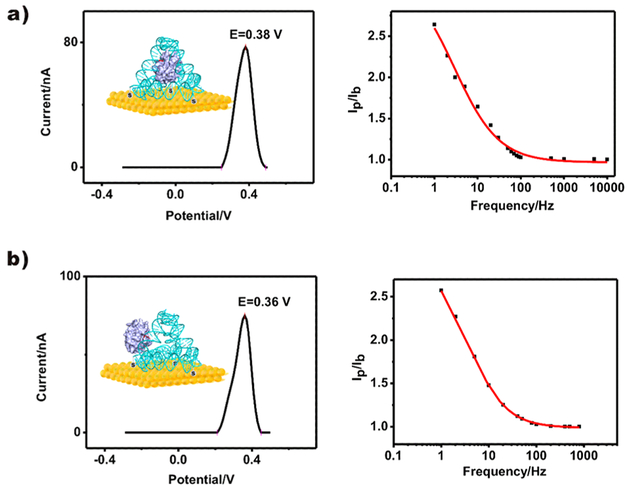
Three-dimensional (3D) DNA nanostructures facilitate the directed self-assembly of various objects with designed patterns with nanometer scale addressability. Here, we report the enhancement of cytochrome c (cyt c) redox activity by using a designed 3D DNA nanostructure attached to a gold electrode to spatially control the position of cyt c within the tetrahedral framework. Charged encapsulation and spatial control result in the significantly increased redox potential and enhanced electron transfer of this redox protein when compared to cyt c directly adsorbed on the gold surface. Two different protein attachment sites on one double stranded edge of a DNA tetrahedron were used to position cyt c inside and outside of the cage. Cyt c at both binding sites show similar redox potential shift and only slight difference in the electron transfer rate, both orders of magnitude faster than the cases when the protein was directly deposited on the gold electrode, likely due to an effective electron transfer pathway provided by the stabilization effect of the protein created by the DNA framework. This study shows great potential of using structural DNA nanotechnology for spatial control of protein positioning on electrode, which opens new routes to engineer redox proteins and interface microelectronic devices with biological function.
Keywords: DNA tetrahedron; cytochrome c; framework nucleic acids; protein engineering.
Conflict of interest statement
Notes
The authors declare no competing financial interest.
Figures
Similar articles
-
Multi-layer electron transfer across nanostructured Ag-SAM-Au-SAM junctions probed by surface enhanced Raman spectroscopy.Phys Chem Chem Phys. 2010 Sep 7;12(33):9822-9. doi: 10.1039/c003082a. Epub 2010 Jun 11. Phys Chem Chem Phys. 2010. PMID: 20544071
-
Electrochemical study of the interaction between cytochrome c and DNA at a modified gold electrode.Anal Biochem. 2005 Apr 1;339(1):46-53. doi: 10.1016/j.ab.2004.11.021. Anal Biochem. 2005. PMID: 15766709
-
Surface-enhanced resonance Raman spectroscopy and spectroscopy study of redox-induced conformational equilibrium of cytochrome c adsorbed on DNA-modified metal electrode.Biosens Bioelectron. 2006 Jul 15;22(1):49-55. doi: 10.1016/j.bios.2005.11.026. Epub 2006 Jan 18. Biosens Bioelectron. 2006. PMID: 16414257
-
Immobilization of cytochrome c and its application as electrochemical biosensors.Talanta. 2018 Jan 1;176:195-207. doi: 10.1016/j.talanta.2017.08.039. Epub 2017 Aug 12. Talanta. 2018. PMID: 28917741 Review.
-
Implementation of cytochrome c proteins and carbon nanotubes hybrids in bioelectrodes towards bioelectrochemical systems applications.Bioprocess Biosyst Eng. 2024 Feb;47(2):159-168. doi: 10.1007/s00449-023-02933-x. Epub 2023 Nov 3. Bioprocess Biosyst Eng. 2024. PMID: 37922017 Review.
Cited by
-
DNA tetrahedral nanostructures for the biomedical application and spatial orientation of biomolecules.Bioact Mater. 2023 Nov 24;33:279-310. doi: 10.1016/j.bioactmat.2023.10.025. eCollection 2024 Mar. Bioact Mater. 2023. PMID: 38076646 Free PMC article. Review.
-
DNA-Scaffolded Proximity Assembly and Confinement of Multienzyme Reactions.Top Curr Chem (Cham). 2020 Apr 4;378(3):38. doi: 10.1007/s41061-020-0299-3. Top Curr Chem (Cham). 2020. PMID: 32248317 Free PMC article. Review.
-
Living electronics: A catalogue of engineered living electronic components.Microb Biotechnol. 2023 Mar;16(3):507-533. doi: 10.1111/1751-7915.14171. Epub 2022 Dec 14. Microb Biotechnol. 2023. PMID: 36519191 Free PMC article. Review.
-
DNA Nanotags for Multiplexed Single-Particle Electron Microscopy and In Situ Electron Cryotomography.JACS Au. 2024 Dec 27;5(1):17-27. doi: 10.1021/jacsau.4c00986. eCollection 2025 Jan 27. JACS Au. 2024. PMID: 39886579 Free PMC article. Review.
-
Antibiofouling Coatings For Marine Sensors: Progress and Perspectives on Materials, Methods, Impacts, and Field Trial Studies.ACS Sens. 2025 Mar 28;10(3):1600-1619. doi: 10.1021/acssensors.4c02670. Epub 2025 Mar 5. ACS Sens. 2025. PMID: 40042466 Free PMC article. Review.
References
-
- Seeman NC Nucleic acid junctions and lattices. J. Theor. Biol 1982, 99 (2), 237–247. - PubMed
-
- Plaxco KW; Simons KT; Baker D Contact order, transition state placement and the refolding rates of single domain proteins. J. Mol. Biol 1998, 277 (4), 985–994. - PubMed
-
- Kuhlman B; Dantas G; Ireton GC; Varani G; Stoddard BL; Baker D Design of a novel globular protein fold with atomic-level accuracy. Science 2003, 302 (5649), 1364–1368. - PubMed
-
- Razeghifard R; Wallace BB; Pace RJ; Wydrzynski T Creating functional artificial proteins. Curr. Protein Pept. Sci 2007, 8(1), 3–18. - PubMed
MeSH terms
Substances
Grants and funding
LinkOut - more resources
Full Text Sources
Other Literature Sources
