

Whole blood transcriptome analysis in amyotrophic lateral sclerosis: A biomarker study
- PMID: 29939990
- PMCID: PMC6016933
- DOI: 10.1371/journal.pone.0198874
Whole blood transcriptome analysis in amyotrophic lateral sclerosis: A biomarker study
Abstract
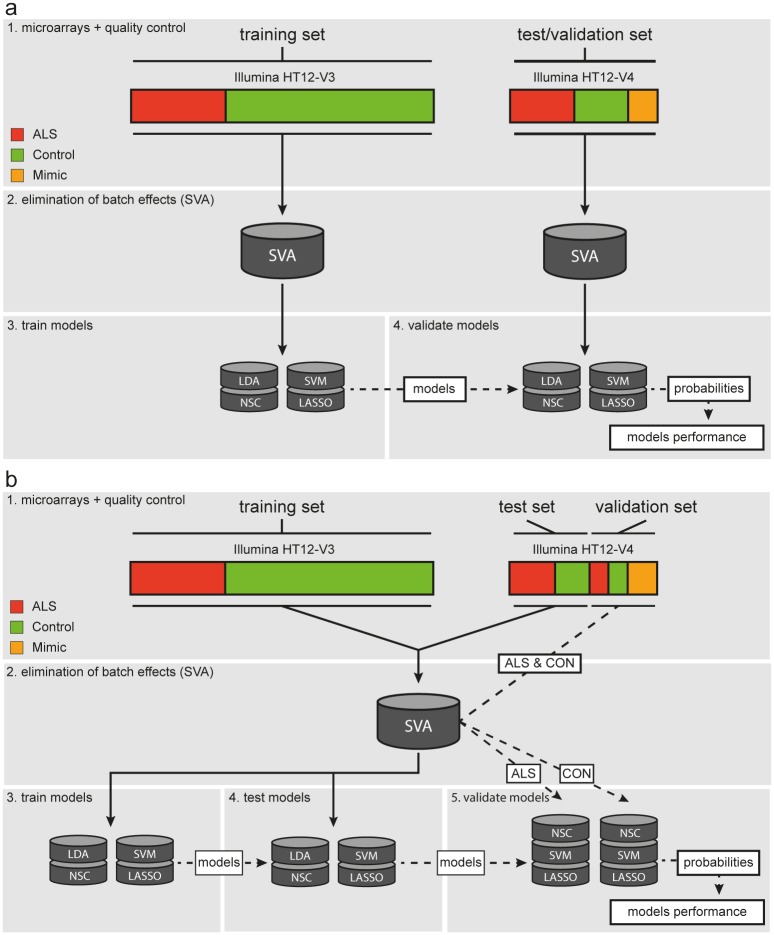
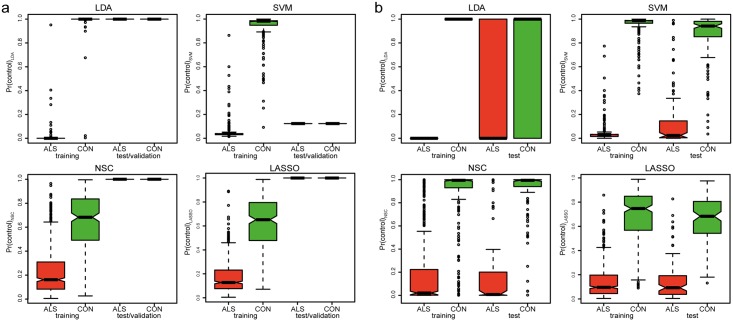
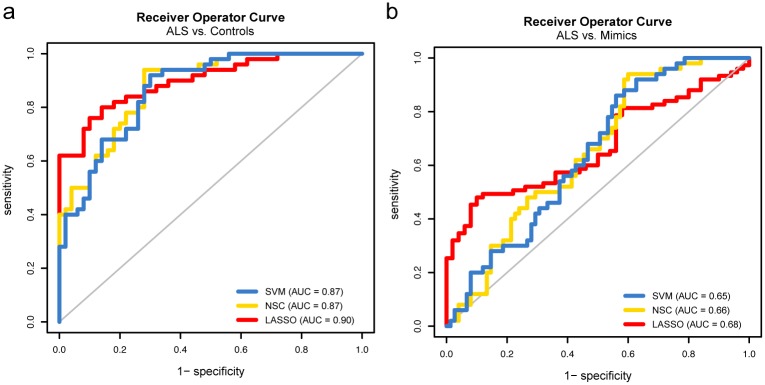
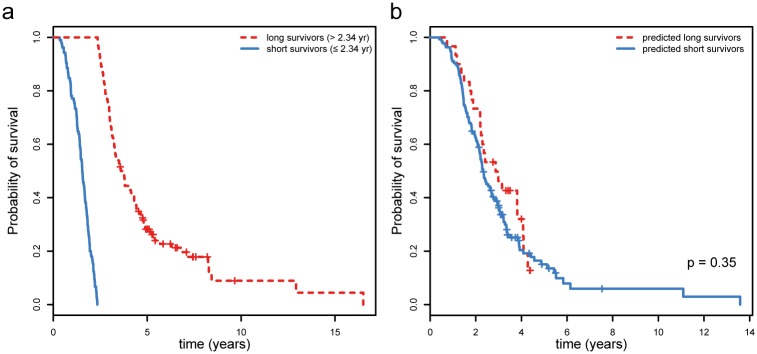
The biological pathways involved in amyotrophic lateral sclerosis (ALS) remain elusive and diagnostic decision-making can be challenging. Gene expression studies are valuable in overcoming such challenges since they can shed light on differentially regulated pathways and may ultimately identify valuable biomarkers. This two-stage transcriptome-wide study, including 397 ALS patients and 645 control subjects, identified 2,943 differentially expressed transcripts predominantly involved in RNA binding and intracellular transport. When batch effects between the two stages were overcome, three different models (support vector machines, nearest shrunken centroids, and LASSO) discriminated ALS patients from control subjects in the validation stage with high accuracy. The models' accuracy reduced considerably when discriminating ALS from diseases that mimic ALS clinically (N = 75), nor could it predict survival. We here show that whole blood transcriptome profiles are able to reveal biological processes involved in ALS. Also, this study shows that using these profiles to differentiate between ALS and mimic syndromes will be challenging, even when taking batch effects in transcriptome data into account.
Conflict of interest statement
LHvdB received travel grants and consultancy fees from Baxter; serves on scientific advisory boards for Prinses Beatrix Spierfonds, Thierry Latran Foundation, Cytokinetics and Biogen Idec. MAvE has received travel grants from Baxter and has consulted for Biogen Idec. This does not alter our adherence to PLOS ONE policies on sharing data and materials.
Figures
References
-
- Chiò A, Logroscino G, Hardiman O, Swingler R, Mitchell D, Beghi E, et al. Prognostic factors in ALS: A critical review. Amyotroph Lateral Scler. 2009;10: 310–323. doi: 10.3109/17482960802566824 - DOI - PMC - PubMed
-
- Hardiman O, van den Berg LH, Kiernan MC. Clinical diagnosis and management of amyotrophic lateral sclerosis. Nat Rev Neurol. Nature Publishing Group; 2011;7: 639–649. - PubMed
-
- Ferraiuolo L, Kirby J, Grierson AJ, Sendtner M, Shaw PJ. Molecular pathways of motor neuron injury in amyotrophic lateral sclerosis. Nat Rev Neurol. Nature Publishing Group; 2011;7: 616–630. - PubMed
Publication types
MeSH terms
Substances
LinkOut - more resources
Full Text Sources
Other Literature Sources
Medical
Molecular Biology Databases
Miscellaneous
