. 2018 Jun 25;14(6):e1007145.
doi: 10.1371/journal.ppat.1007145. eCollection 2018 Jun.

Non-linear hierarchy of the quorum sensing signalling pathway in bloodstream form African trypanosomes

Affiliations

Non-linear hierarchy of the quorum sensing signalling pathway in bloodstream form African trypanosomes

Lindsay McDonald et al. PLoS Pathog. .

Abstract

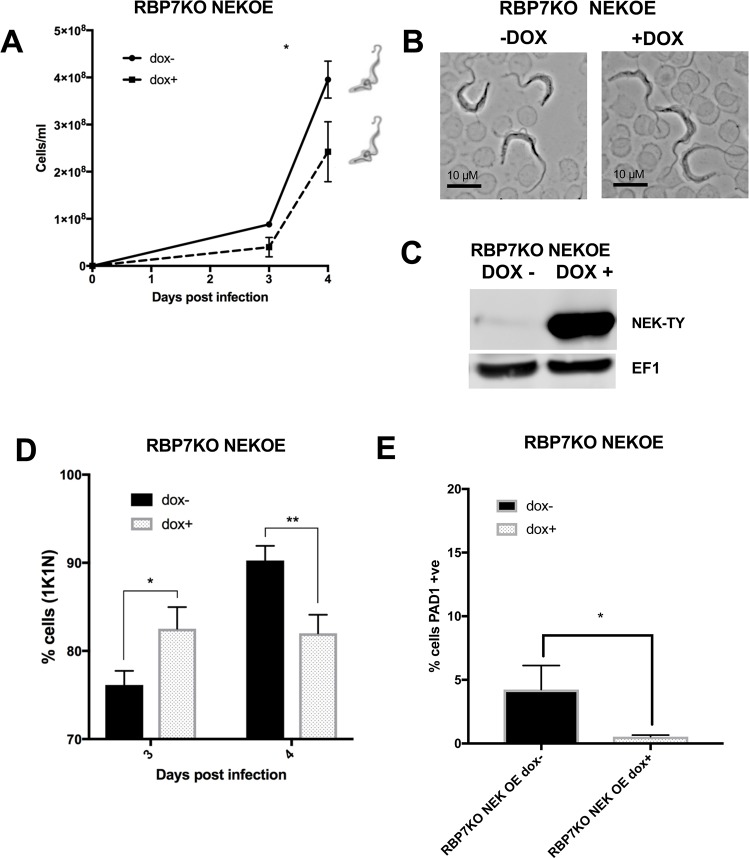
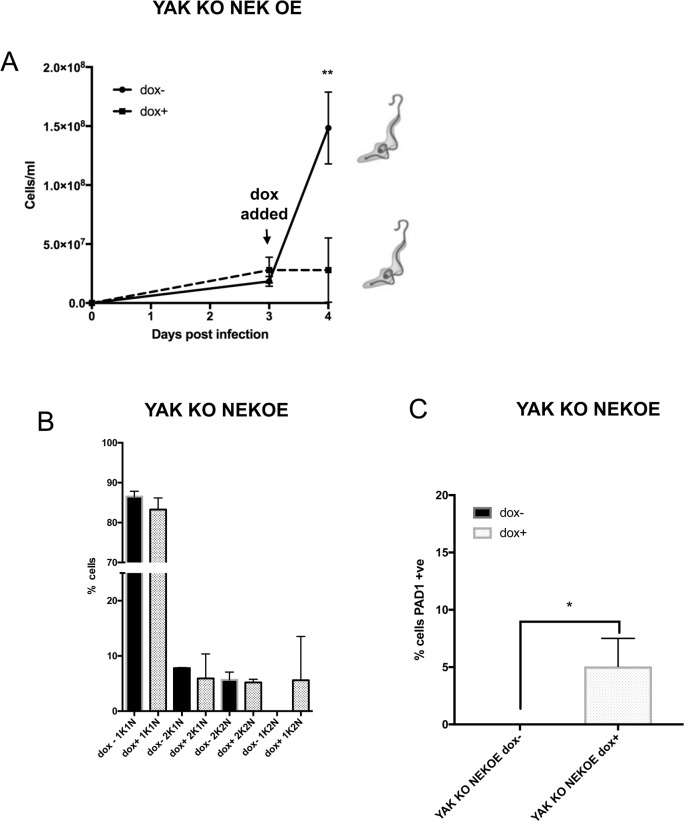
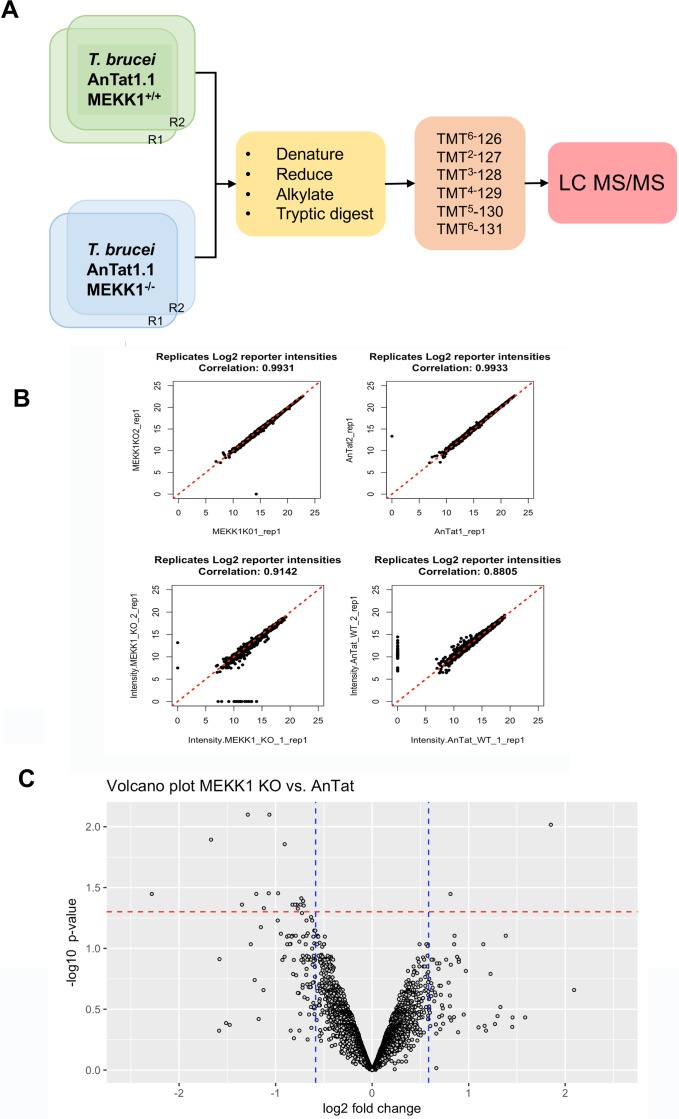
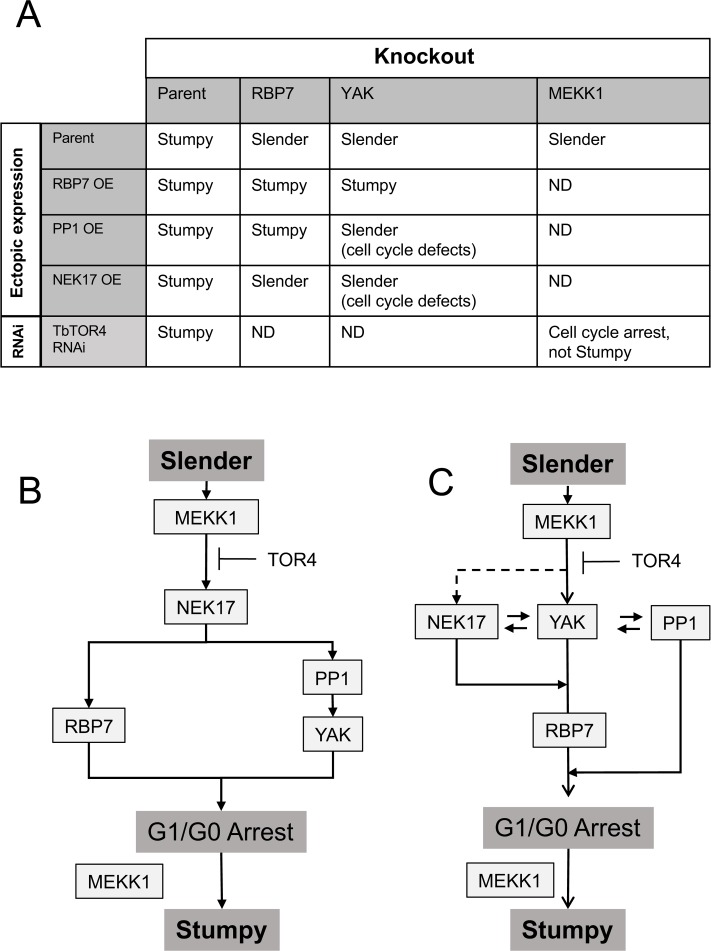
Trypanosoma brucei, the agents of African trypanosomiasis, undergo density-dependent differentiation in the mammalian bloodstream to prepare for transmission by tsetse flies. This involves the generation of cell-cycle arrested, quiescent, stumpy forms from proliferative slender forms. The signalling pathway responsible for the quorum sensing response has been catalogued using a genome-wide selective screen, providing a compendium of signalling protein kinases phosphatases, RNA binding proteins and hypothetical proteins. However, the ordering of these components is unknown. To piece together these components to provide a description of how stumpy formation arises we have used an extragenic suppression approach. This exploited a combinatorial gene knockout and overexpression strategy to assess whether the loss of developmental competence in null mutants of pathway components could be compensated by ectopic expression of other components. We have created null mutants for three genes in the stumpy induction factor signalling pathway (RBP7, YAK, MEKK1) and evaluated complementation by expression of RBP7, NEK17, PP1-6, or inducible gene silencing of the proposed differentiation inhibitor TbTOR4. This indicated that the signalling pathway is non-linear. Phosphoproteomic analysis focused on one pathway component, a putative MEKK, identified molecules with altered expression and phosphorylation profiles in MEKK1 null mutants, including another component in the pathway, NEK17. Our data provide a first molecular dissection of multiple components in a signal transduction cascade in trypanosomes.


Conflict of interest statement

The authors have declared that no competing interests exist.

Figures

Fig 1
Fig 1. Schematic representation of the experimental approach.
A. linear signal transduction pathway is represented which, when activated, signals slender forms to differentiate into stumpy forms. If a pathway component is removed (e.g. component C), then stumpy formation is prevented and the parasites remain slender. However, if a component downstream is overexpressed (‘OE’), or a constitutively active mutant expressed, the pathway function can be restored, and stumpy formation occurs. If the overexpressed pathway component is upstream of the breakpoint, the parasites remain slender. B. Strategy for the creation of cell lines to test extragenic suppression in the SIF signalling pathway. For creating null mutants, sequential allelic deletion (step 1) used antibiotic resistance cassettes targeting a given PosST (Positive regulator of STumpy formation) gene in the T. brucei EATRO 1125 AnTat1.1 90:13 parental line, that is capable of tetracycline inducible gene expression. Ectopic expression in the resulting null mutant of a further PosST gene, modified by incorporation of the Ty1 epitope tag sequence was achieved under tetracyclic-inducible regulation (steps 2,3) via the tetracycline/doxycycline regulated T7 promoter (‘TETO T7’).
Fig 2
Fig 2. Null mutants for RBP7AB and YAK fail to differentiate to stumpy forms.
A. Pleomorphic null mutants for RBP7AB were assayed for stumpy formation in vivo. The parasitaemia of the null mutants (◼) increased without differentiation until the infections were terminated on humane grounds (✝). The parental T. brucei EATRO 1125 AnTat1.1 90:13 line (●) showed reduced growth from day 3, and by day 4 of infection, were developing to intermediate and stumpy forms, this being represented schematically on the graph. Note that the relative growth of parental and null mutants cannot be directly compared, these being independent cell lines; the parental cells are included to show the progression from slender to stumpy forms in normal infections. B. %1K1N of cells on day 4 of infection for the parental (‘AnTat’) or the RBP7AB null mutant line. **P<0.005 GLM and Tukey test for multiple comparisons. C. Pleomorphic null mutants for YAK were assayed for stumpy formation in vivo. The parasitaemia of the null mutants (◼) increased without differentiation until the infections were terminated on humane grounds (✝). The parental T. brucei EATRO 1125 AnTat1.1 90:13 line (●) showed reduced growth from day 3, and by day 4 of infection, were developing to intermediate and stumpy forms, this being represented schematically on the graph. Note that the relative growth of parental and null mutants cannot be directly compared, these being independent cell lines; the parental cells are included to show the progression from slender to stumpy forms in normal infections. D. %1K1N of cells on day 4 of infection for the parental (‘AnTat’) or the YAK null mutant line. ***P<0.0005 GLM and Tukey test for multiple comparisons. E. Cell lines harvested on day 4 of infection, assayed by flow cytometry for PAD1expression. F. Cell lines incubated in SDM-79 medium and exposed to 6mM cis aconitate (CA) after which they were assayed for EP Procyclin expression at 4 hours.
Fig 3
Fig 3. RBP7 ectopic expression induces stumpy formation in YAK null mutants in vivo.
A. Growth of the YAK null mutant in which RBP7B ectopic expression was induced (▼), or not (▲) by provision of doxycycline in vivo. The inset panel shows a northern blot of RBP7AB mRNA expression in the uninduced (-dox) or induced (+dox) parasites on day 4 of infection; an irrelevant lane has been removed. The dominant morphology of the cells at day 4 of infection is indicated schematically. Infection terminated on humane grounds, ✝. ***P<0.0005. B. Morphology of YAK null mutants induced or not to express RBP7B. Representative cells are shown from day 4 of infection. Cells induced to express RBP7B were more intermediate/stumpy in morphology compared to uninduced cells, which remained slender in morphology. Bar = 10μm. C. Left hand panel; cell cycle arrest status of YAK null mutants with ectopic RBP7B expression induced or not, in vivo, on day 3 and 4 of infection. The proportion of cells with 1K1N was higher where RBP7B expression was induced (* p<0.05). The right-hand panel shows the expression of PAD1 determined by immunofluorescence on day 3 and day 4 of infection. PAD1 expression was detected when RBP7B ectopic expression was induced (** p<0.005).
Fig 4
Fig 4. PP1-6 ectopic expression restores stumpy formation in RBP7 null mutants.
A. Inducible ectopic expression of PP1-6 in T. brucei EATRO 1125 AnTat1.1 90:13 parental cells (◼, +dox; ●, -dox) (*** p<0.0005). The dominant morphology of the cells on day 4 is shown schematically, which was stumpy in the induced samples and a mixture of slender, intermediate and stumpy in the uninduced samples. The inset northern blot shows PP1 transcript levels in the induced and uninduced cells; rRNA is the loading control. The right panel shows the expression of EP procyclin 4 hours after parasites were harvested on day 4 of infection and incubated in 6mM cis aconitate (*** p<0.0005). Infection terminated on humane grounds, ✝. B. Inducible ectopic expression of PP1-6 in T. brucei EATRO 1125 AnTat1.1 90:13 RBP7AB null mutants (◼, +dox; ●, -dox); (** p<0.005). The dominant morphology of the cells on day 4 is shown schematically. The inset northern blot shows PP1 transcript levels in the induced and uninduced cells; rRNA is the loading control. The right panel shows the expression of EP procyclin 4 hours after parasites were harvested on day 4 of infection and incubated in 6mM cis aconitate (* p<0.05). C. Morphology of RBP7AB null mutants induced (+dox) or not (-dox) to express PP1-6 (RBP7 KO PP1 OE). Bar = 10μm. D. Western blot of PAD1 expression in parental parasites (WT), RBP7AB null mutant (RBP7 KO) cells, or in parental cells (‘PP1 OE’) or in the null mutant (RBP7KO PP1 OE) induced (+dox) or not (-dox) to ectopically express PP1-6. The RBP7AB null mutant expresses PAD1 upon PP1-6 ectopic expression. EF1alpha provides a loading control.
Fig 5
Fig 5. Cytological characteristics of YAK null mutants induced to ectopically express PP1.
A. Inducible ectopic expression of PP1-6 in T. brucei EATRO 1125 AnTat1.1 90:13 YAK null mutants (◼, +dox; ●, -dox); (*** p<0.0005). The dominant morphology of the cells on day 4 is shown schematically. The inset northern blot shows PP1 transcript levels in the induced and uninduced cells; rRNA is the loading control. The right panel shows the expression of EP procyclin 4 hours after parasites were harvested on day 4 of infection and incubated in 6mM cis aconitate (* p<0.05). B. Western blot of PAD1 expression in parental parasites (WT), YAK null mutant (YAK KO) cells, or in parental cells (‘PP1 OE’) or in the null mutant (YAK KO PP1 OE) induced (+dox) or not (-dox) to ectopically express PP1-6. The YAK null mutant does not express PAD1 upon PP1-6 ectopic expression. C. Morphology of YAK null mutants induced (+dox) or not (-dox) to express PP1-6. A DAPI stained image of the cells (lower two panels) is also shown to highlight the aberrant nuclear morphology of induced cells with PP1-6 expression. Bar = 10μm. D. Analysis of the aspect ratio (left panel) and solidity (right panel) of YAK null mutants induced (+dox), or not (-dox) to express PP1-6. (**** p<0.00005).
Fig 6
Fig 6. NEK17 induced differentiation is dependent on RBP7.
A. Growth in vivo upon inducible ectopic expression of NEK17 in the RBP7AB null mutant. The dominant morphology of the cells on day 4 is shown schematically. Induced (+dox; ◼), uninduced (-dox; ●) over 4 days growth. B. Morphology of RBP7AB null mutants induced, or not, to ectopically express NEK17. Samples were isolated on day4 of infection. Bar = 10μm. C. Western blot demonstrating inducible ectopic expression of NEK17 in the RBP7AB null mutant. + dox, induced; -dox, uninduced. Elongation factor 1 alpha (EF1) provides the loading control. D. % 1K1N cells upon inducible ectopic expression of NEK17 in the RBP7AB null mutant at day 3 and day 4 post infection (* p<0.05; ** p<0.005). E. % PAD1 cells upon inducible ectopic expression of NEK17 in the RBP7AB null mutant at day 4 post infection (* p<0.05). Less PAD1 expression is detected in the NEK OE due to their lower overall parasitaemia than in the uninduced population (Fig 6A) with respect to RBP7AB KO cells alone (Fig 2E).
Fig 7
Fig 7. NEK17 induced differentiation is dependent on YAK.
A. Growth in vivo upon inducible ectopic expression of NEK17 in the YAK null mutant. Induced (+dox; ◼), uninduced (-dox; ●) over 4 days growth, with doxycycline added on day 3 post infection. A schematic of the dominant morphology of each parasite population is shown. B. % 1K1N, 2K1N, 2K2N and the aberrant 1K2N cells upon inducible ectopic expression of NEK17 in the YAK null mutant at day 4 post infection. The data represents the mean and standard deviation of 250 cells counted at each time point in each infection. C. % PAD1 cells upon inducible ectopic expression of NEK17 in the YAK null mutant at day 4 post infection (* p<0.05).
Fig 8
Fig 8. TbTOR4 drives growth arrest independently of MEKK1.
A. Parasitaemia of the TbTOR4 RNAi line, MEKK1 null mutant, or TbTOR4 RNAi in the MEKK1 null mutant. In the left hand panel, TbTOR4 silencing promotes stumpy formation; Doxycycline + (RNAi induced; ◼), doxycycline– (RNAi uninduced; ●). In the middle panel, the MEKK1 null mutants (◼) are more virulent than parental (‘AnTat’) cells (●), consistent with the reduced capacity for stumpy formation. In the right-hand panel, when TbTOR4 is depleted by inducible RNAi (◼) MEKK1 null mutants show slow growth compared with MEKK1 null mutants where TbTOR4 is not depleted (●). Infections were humanely terminated in the uninduced MEKK1 KO TbTOR4RNAi infections on day 4 and so day 5 data is absent (✝). *, p<0.05; **, p<0.005; ***, p<0.0005. B. Cell cycle progression of the cell lines analysed in vivo in Panel A. Left panel, TbTOR4 RNAi shows enhanced levels of 1K1N cells at day 3 of infection, but by day 4 the uninduced cells have also progressed to stumpy forms. Middle panel, MEKK1 null mutants show less accumulation in 1K1N than parental (‘AnTat’) cells. Right hand panel; when TbTOR4 is depleted in the MEKK1 null mutant, parasites show a higher proportion of 1K1N cells, such that TbTOR4 depletion overrides the absence of MEKK1. Infections were humanely terminated in the uninduced MEKK1 KO TbTOR4 RNAi infections on day 4 and so day 5 data is absent (✝). *, p<0.05; **, p<0.005; ***, p<0.0005. C. PAD1 expression when TbTOR4 RNAi is induced in parental cells (left hand panel) or in the MEKK1 null mutant (right hand panel). In the TbTOR4 RNAi line on day 5 PAD1 expression in the uninduced cells exceeds the induced cells because these cells have progressed to stumpy at high parasitaemia; in contrast, the induced cells show incomplete TbTOR4 RNAi and cells with effective knockdown express PAD1 early (day 3 and 4), while those without effective knockdown continue to proliferate as slender forms and express less PAD1 because the overall parasitaemia is lower. The middle panel shows less PAD1 is expressed in the absence of MEKK1 compared with parental (‘AnTat’) cells. Infections were humanely terminated in the uninduced MEKK1 KO TbTOR4 RNAi infections on day 4 and so day 5 data is absent (✝). *, p<0.05; **, p<0.005; ***, p<0.0005.
Fig 9
Fig 9. Phosphoproteomic analysis of a MEKK1 null mutant.
A. Experimental approach. T. brucei EATRO 1125 AnTat1.1 90:13 and MEKK1 null mutants were grown in culture and harvested after identical growth profiles and at low cell density to maintain them as the slender developmental form. Samples were isolated, processed, subjected to isobaric mass tagging and then analysed by LC MS/MS. B. Reproducibility of the identified protein and phosphoprotein profiles derived from the replicates of the parental (‘AnTat1.1’) and MEKK1 null mutant cells. C. Volcano plot analysis of phosphopeptide changes between the parental and MEKK1 null mutant. Analyses focused on changes that were statistically significant (adjusted P value <0.05; shown with red dashed lines on the–log10 scale) and at least 1.5-fold different (shown as blue dashed lines on the Log2 scale) between the parental and MEKK1 null mutant.
Fig 10
Fig 10. Pathway models and dependency relationships for the interactions studied in this work.
A. A summary of the ectopic expression and gene knockout or RNAi combinations used in this study. B. In this model, the pathway is branched but neither branch is redundant. C. In this model, the pathway is unbranched but the presence of YAK is necessary for PP1-6 to generate stumpy forms when expressed. RBP7 is required for the NEK17 expression induced growth phenotype; in YAK null mutants NEK17 expression generates slow growth. MEKK1 is needed for cell cycle arrest, although this can be overcome when TbTOR4 is depleted. However, MEKK1 is needed for the effective development of stumpy forms in TbTOR4 arrested cells. The dotted line indicates the potential for MEKK1 to directly or indirectly phosphorylate NEK17 as determined by phosphoproteomic analysis.

References

    1. Waters CM, Bassler BL. Quorum sensing: cell-to-cell communication in bacteria. Annual review of cell and developmental biology. 2005;21:319–46. Epub 2005/10/11. doi: 10.1146/annurev.cellbio.21.012704.131001 . - DOI - PubMed
    1. Druker BJ, Mamon HJ, Roberts TM. Oncogenes, growth factors, and signal transduction. N Engl J Med. 1989;321(20):1383–91. Epub 1989/11/16. doi: 10.1056/NEJM198911163212007 . - DOI - PubMed
    1. Marsh L, Neiman AM, Herskowitz I. Signal transduction during pheromone response in yeast. Annu Rev Cell Biol. 1991;7:699–728. Epub 1991/01/01. doi: 10.1146/annurev.cb.07.110191.003411 . - DOI - PubMed
    1. Parent CA, Devreotes PN. Molecular genetics of signal transduction in Dictyostelium. Annual Review of Biochemistry. 1996;65:411–40. doi: 10.1146/annurev.bi.65.070196.002211 - DOI - PubMed
    1. O'Farrell PH. Quiescence: early evolutionary origins and universality do not imply uniformity. Philos Trans R Soc Lond B Biol Sci. 2011;366(1584):3498–507. doi: 10.1098/rstb.2011.0079 ; PubMed Central PMCID: PMCPMC3203459. - DOI - PMC - PubMed

Publication types