. 2018;47(4):1509-1532.
doi: 10.1159/000490867. Epub 2018 Jun 21.

Gαi Proteins are Indispensable for Hearing

Affiliations

Gαi Proteins are Indispensable for Hearing

Sandra Beer-Hammer et al. Cell Physiol Biochem. 2018.

Abstract

Background/aims: From invertebrates to mammals, Gαi proteins act together with their common binding partner Gpsm2 to govern cell polarization and planar organization in virtually any polarized cell. Recently, we demonstrated that Gαi3-deficiency in pre-hearing murine cochleae pointed to a role of Gαi3 for asymmetric migration of the kinocilium as well as the orientation and shape of the stereociliary ("hair") bundle, a requirement for the progression of mature hearing. We found that the lack of Gαi3 impairs stereociliary elongation and hair bundle shape in high-frequency cochlear regions, linked to elevated hearing thresholds for high-frequency sound. How these morphological defects translate into hearing phenotypes is not clear.

Methods: Here, we studied global and conditional Gnai3 and Gnai2 mouse mutants deficient for either one or both Gαi proteins. Comparative analyses of global versus Foxg1-driven conditional mutants that mainly delete in the inner ear and telencephalon in combination with functional tests were applied to dissect essential and redundant functions of different Gαi isoforms and to assign specific defects to outer or inner hair cells, the auditory nerve, satellite cells or central auditory neurons.

Results: Here we report that lack of Gαi3 but not of the ubiquitously expressed Gαi2 elevates hearing threshold, accompanied by impaired hair bundle elongation and shape in high-frequency cochlear regions. During the crucial reprogramming of the immature inner hair cell (IHC) synapse into a functional sensory synapse of the mature IHC deficiency for Gαi2 or Gαi3 had no impact. In contrast, double-deficiency for Gαi2 and Gαi3 isoforms results in abnormalities along the entire tonotopic axis including profound deafness associated with stereocilia defects. In these mice, postnatal IHC synapse maturation is also impaired. In addition, the analysis of conditional versus global Gαi3-deficient mice revealed that the amplitude of ABR wave IV was disproportionally elevated in comparison to ABR wave I indicating that Gαi3 is selectively involved in generation of neural gain during auditory processing.

Conclusion: We propose a so far unrecognized complexity of isoform-specific and overlapping Gαi protein functions particular during final differentiation processes.

Keywords: Cochlear hair cell maturation; Deafness gene; Gαi3/GNAI3; Heterotrimeric G-proteins; Neural gain; Stereocilia bundle.


Conflict of interest statement

Disclosure Statement

The authors declare no competing financial interest.

Figures
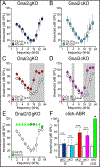
Fig. 1.
Fig. 1.
ABR thresholds of gene-targeted Gnai KO mice. (A-E) Frequency tone-burst-evoked ABR (f-ABR) thresholds, mean±SD from 4 to 8 mice (number of ears in brackets). (A,B) Frequency tone-burst-evoked ABR thresholds were not affected in (A) global (gKO) and (B) tissue-specific (cKO) Gnai2 KO mice. (C,D) High-frequency loss occurs in (C) Gnai3 gKO and (D) cKO. ABR thresholds in Gnai3 gKO and cKO are significantly elevated for stimulation frequencies above 8 kHz (shaded areas, p< 0.05). (E) Profound ABR threshold loss was found in Gnai2/i3 cKO mice over all stimulus frequencies. Arrows indicate ABR thresholds exceeding the maximum tested stimulus level. (F) Click-evoked ABR (click-ABR) thresholds for the mice mutants (global deletion of Gnai2, dark blue, conditional deletion of Gnai2, light blue, global deletion of Gnai3, red, conditional deletion of Gnai3, purple, conditional double deletion of Gnai2/i3, green) vs. their respective controls (white). n.s. not significant, “star” p< 0.05, “***” p< 0.001. Detailed statistic is depicted in (see online suppl. material) suppl. Fig. 2 and suppl. Table 2.
Fig. 2.
Fig. 2.
DPOAE thresholds and DPOAEs amplitude I/O function in Gnai2 and Gnai3 gene-targeted mice. (A,B) OHC function in global and tissue-specific Gnai2 KO is not impaired. Mean±SD DPOAE thresholds (left panels) and DPOAEs amplitude I/O function evoked by stimulus f2=11.3 kHz (right panels) above noise floor (crosses) for Gnai2 gKO (A, KO) and Gnai2 cKO mice (B, KO) and their respective controls (Ctr) are similar. (C,D) Impairment of OHC function at high-frequency regions in global and tissue-specific Gnai3 KO mice. Mean±SD DPOAE thresholds (left panels) and DPOAEs amplitude I/O function (right panels) for Gnai3 gKO (C) and Gnai3 cKO mice (D), and their respective controls. DPOAE thresholds for stimulation frequencies above 8 kHz are significantly elevated and DPOAE amplitudes were significantly reduced in KO mice compared to the respective controls. (E) OHC function is lost in Gnai2/i3 cKO mice. Mean±SD DPOAE thresholds (left panels) and DPOAEs amplitude I/O function evoked by stimulus f2=11.3 kHz (right panels) for Gnai2/i3 cKO and their respective controls. Remarkable loss of thresholds at most testing frequencies and reduction of amplitudes are evident. Grey-shaded areas represent statistically significant post-hoc comparisons with p< 0.05 after Bonferroni corrections. “n.s.” and “***” indicate level of statistical significance p> 0.05 and p< 0.001, respectively. Data points represent the mean of 6 to 14 ears (numbers in brackets close to legend key) from 4 to 7 mice (A-D) and 3 to 4 ears from 2 mice (E).
Fig. 3.
Fig. 3.
Stereociliar configuration of OHCs in apical and basal cochlear turns from gene-targeted Gnai KO mice. (A) Phalloidin staining of control (Ctr, left panel) and Gnai3 gKO (right panel) OHC stereocilia bundles in P11–12 whole-mount cochlea for both cochlear turns. Scale bars 10μm. 3,2,1: OHC row. One representative animal of n=4–8 is shown. (B) Gaussian distribution of OHC stereocilia spreading angle for control (black) and Gnai3 gKO (red). Gnai3 gKO have significantly shallowed V-shaped bundles (Phi>110°) in basal turn OHCs, depicted by shaded area and encircled wide-spreaded chevron icons. Upper panel, OHCs from apical cochlear turn. Middle panel, OHCs from basal cochlear turn. Curves illustrate a fit of normal distribution for either group, ordinate gives absolute number of cells. Lower panel, quantification of OHCs with Phi>110° (%) of total cells analyzed (Gnai3 gKO 32–36 cells; Gnai3 ctr 26–29 cells). (C,D) Scanning electron microscopy of apical and basal stereocilia from control and Gnai3 cKO mice confirms normal hair bundle shape in apical cochlear turn (C) and the disorganized ultrastructure of OHC bundles from basal turns of Gnai3 cKO (D). Hair bundle shape is outlined in yellow. Blue arrows point to asymmetrically shaped bundles. Scale bars, 1μm. One representative animal of n=3 is shown. (E) Significantly reduced stereocilia length (left panel) and number (right panel) in basal cochlear turn of Gnai3 cKO mice. Stereocilia length was assessed in 20 (Ctr) and 11 (Gnai3 KO) independent experiments (depicted as individual dots) in tissue samples from 4 control and 4 Gnai3 KO mice. Stereocilia length was derived from a total of 64 hair cells of control mice and 64 hair cells of Gnai3 KO mice. A total of 272 stereocilia and 305 stereocilia could be measured for control and KO mice, respectively. Stereocilia number per hair cell was counted in 12 and 14 independent experiments (countings depicted as dots) for 5 control and 4 Gnai3 KO mice, respectively. From 87 and 106 hair cells from control and Gnai3 KO mice, a total of 8299 and 7621 stereocilia could be counted, respectively. Stereocilia number ranged from 72–119 in control mice and 46–86 in Gnai3 KO mice. For both parameters median and single values are depicted. “**” and “***” indicate level of statistical significance p= 0.0107 and p< 0.0001, respectively. (F) Phalloidin (red) and espin (green) staining of Gnai2/i3 cKO OHC indicate abnormal bundle shape in apical low-frequency turns. Scale bars 10μm.
Fig. 4.
Fig. 4.
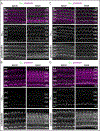
i2 and Gαi3 expression in the inner ear. (A-D) Surface view of whole-mount preparations of rat cochleae at P2 and P10. (A, B) Gαi2 and (C,D) Gαi3 labeling (green in upper panel and white in middle panel) in the actin-rich hair bundles labeled by phalloidin (purple in upper panel and white in lower panel). (A,C) At P2, Gαi2 (A) and Gαi3 (C) localizes at the tip of the OHC hair bundles in apical but only Gαi3 in basal cochlear turns, whereas (B,D) at P10 Gαi1/i2 (B) and Gαi3 antibody (D) stains in IHCs in the apical but only Gαi3 in the basal turn. Scale bars 7μm. One representative animal of n=5 is shown.
Fig. 5.
Fig. 5.
Electrocochleography from gene-targeted Gnai3 KO mice. (A-C) Electrocochleographic responses of Gnai3 cKO mice are reduced by >2-fold confirming that the reduced cochlear output has its origin already at the receptor level (hair cell potentials). (A) Compound action potentials (CAP) - response from the auditory nerve. The circle highlights the similar slope of close-threshold CAP response growth. (B) summating potentials (SP) - determent potential from all hair cells. (C) cochlear microphonics (CM) - receptor potential of OHCs. Mean±SEM of 4 ears (4 mice). Differences of CAP, SP, and CM responses reach statistical significance at high stimulus levels (≥70dB SPL, shaded areas, p<0.05, post-hoc pair-wise Bonferroni’s multiple comparison test). ***p< 0.001 for differences in factor genotype (2-way ANOVA for repeated measurements). Detailed statistic is depicted in (see online suppl. material) suppl. Table 2.
Fig. 6.
Fig. 6.
i2 and Gαi3 exhibit mutually redundant functions for IHC but not OHC differentiation. (A) Immunostaining of OHC functional markers KCNQ4 and prestin along the cochlear turns of 7- to 8-week-old control (Ctr) and Gnai3 cKO mice. No obvious differences of KCNQ4 (red) and prestin (green) expression are observed in OHCs from control and Gnai3 cKO mice as exemplified for high-frequency cochlear regions. One representative animal of n=5–7 is shown. (B) GFP expression in IHCs of 4-week-old Gnai3-GFP reporter mice confirming Gαi3 expression, whereas GFP is not detectable in IHCs of control littermates. One representative animal of n=2 is shown. (C) Immunostaining of CtBP2/RIBEYE (red) and otoferlin (green) in basal cochlear turn of 7- to 8-week-old control and Gnai3 cKO IHCs. No obvious differences in CtBP2/RIBEYE and otoferlin expression are observed between control and KO mice. One representative animal of n=2–4 is shown. (D) No significant difference in mean IHC ribbon counts±SD of 7- to 8-week-old control and Gnai3 cKO mice. Circles represent ribbon counts for individual animals (n=3 ears from 3 mice). (E, F) Schematic illustration of localization of SK2 and BK in immature (E) and mature (F) IHCs. (G) Normal otoferlin (green), BK (red), and VAMP 2 (green) immunostaining and expected lack of SK2 (red) in IHCs in basal cochlear turns of 7- to 8-week-old Gnai3 cKO mice (n=2–3 mice). (H) Immunostainings show immature SK2 expression and missing BK expression in 7- to 8-week-old Gnai2/i3 cKO IHCs (n=1–2 mice). (G, H) Otoferlin is used as IHC marker. VAMP2 stains efferent nerves. Circles indicate nuclei of IHCs. (G, H upper panel). Closed arrows indicate localization of SK2 in immature IHCs and open arrows indicate SK2 expression in OHCs. (G, H lower panel) Closed arrows indicate BK staining and open arrows indicate VAMP 2 staining. Scale bars, 10μm.
Fig. 7.
Fig. 7.
ABR amplitudes, latencies, wave IV to wave I amplitude ratios, and ABR thresholds change over age in global and conditional Gnai3 KO mice. (A) Individual ABR waveform from control (Ctr, black) and Gnai3 KO (red and purple line) 1- to 3-month-old mice with indicated wave I and wave IV peak-to-peak amplitude (amplitude) and leading peak latency (latency). (B,C) ABR wave I (upper panels) and IV (lower panles) amplitude I/O functions (left panels) with slope (insets) and wave I and IV leading peak latency I/O function (right panels) for Gnai3 gKO (B), Gnai3 cKO (C) and respective control mice. Decrease of amplitudes, amplitude slope and increase of wave I latencies are evident in the KO mice (shaded areas, p< 0.05). (D) Age-related loss of ABR thresholds to 11.3 kHz stimuli for Gnai3 gKO and Gnai3 cKO mice at the age of 1–3 months (triangles) and 5–7 months (circles). Progression of threshold loss occurs in both KO mouse lines (dashed lines). The loss of ABR thresholds per month of age in Gnai3 KO mice significantly exceeded the loss in control mice (graph bars). The loss of ABR threshold per month was significantly larger in Gnai3 gKO mice than in Gnai3 cKO (star, p<0.05), and not significantly different between both control groups (n.s.). Thresholds for individual ears are denoted by small symbols. (E) ABR wave IV/I ratios for Gnai3 gKO, Gnai3 cKO and respective control mice. Significant elevation of wave IV/I ratios at middle to high stimulation levels is found only in Gnai3 cKO mice. Mean±SEM (straight error bars) or SD (error bars with caps) from 4 to 9 mice (number of ears in brackets).
Fig. 8.
Fig. 8.
Expression of Gαi3 in the spiral ganglion. (A) Sections through the spiral ganglion stained with Gαi3 antibodies reveal its presence in control (Ctr) and Gnai3 cKO mice but not in Gnai3 gKO mutants. One representative animal of n=2 is shown. Scale bars, 5μm (B) Schematic illustration of the expected Nf200, Kir4.1, Sox10, brevican, and Gαi3 immunoreactivity in the soma of a single spiral ganglion neuron and the ensheathing satellite (glia) cell, and the surrounding perineural net matrix. Lac Z staining of Foxg1cre/+ROSA 26 reveals activity of Cre in the cytoplasm of spiral ganglion neurons (middle panel, some somas are indicated with arrows) but not in neighboring Sox10-labelled satellite cells (right panel, some cells are indicated with white outlines). Scale bars, 15μm. One representative animal of n=2 is shown. (C, D) Sections through the spiral ganglion co-labelled with Gαi3 and Kir4.1 antibodies confirm its presence in satellite cells surrounding Nf200 positive spiral ganglion neurons. Gαi3 itself is surrounded by the perineuronal marker brevican. Scale bars, 5μm. One representative animal of n=2–5 is shown.
Fig. 9.
Fig. 9.
i3 and vGLUT1 expression in the ventral cochlear nucleus. (A,B) Left panels: Overview of cross sections showing dorsal (DCN) and ventral (VCN) cochlear nucleus of Gnai3 gKO (A) and Gnai3 cKO (B) and corresponding controls (Ctr). Scale bars 200μm. Middle and right panels: stained with Gαi3-specific antibodies (red) and the vesicular-glutamate-transporter-1 (vGLUT1, green). Note the absence of Gαi3 labeling contacted by vGLUT1 in Gnai3 gKO (A) but not cKO (B). One representative animal of n=2 is shown. Scale bars 5μm.
Fig. 10.
Fig. 10.
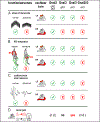
Schematic illustration of supposed roles of Gαi2 and Gαi3 for hearing. (A) Hair bundles in low-frequency cochlear regions are shaped by Gαi2 and Gαi3 activity and hair bundles in high-frequency cochlear regions are shaped by specific activity of Gαi3 that cannot be replaced by Gαi2. (B) During the maturation process the reorganization of the axosomatic efferent nerves is described by the downregulation of SK2 and upregulation of BK channels. Gαi2 and Gαi3 exhibit mutual redundant activity to trigger the final maturation of IHC synapses, whereas upon deletion of both Gαi proteins IHCs remain in an immature stage characterized by a sustained SK2 expression and a failure of BK upregulation. (C) For hearing in low-frequency regions expression of either Gαi2 or Gαi3 is indispensable, whereas in high-frequency regions Gαi3 expression is crucial for proper hearing. (D) Central neural gain adjustment in response to impaired auditory input is presumably shaped by Gαi3 activity in satellite cells or brainstem auditory neurons, as Gαi3 is absent in Gnai3 gKO but not in Gnai3 cKO mice in these cells. n.d., not determined. LF, low-frequency. HF, high-frequency.

References

    1. Neves SR, Ram PT, Iyengar R: G protein pathways. Science 2002;296:1636–1639. - PubMed
    1. Rosenbaum DM, Rasmussen SG, Kobilka BK: The structure and function of G-protein-coupled receptors. Nature 2009;459:356–363. - PMC - PubMed
    1. Wong YH, Federman A, Pace AM, Zachary I, Evans T, Pouyssegur J, Bourne HR: Mutant a subunits of Gi2 inhibit cyclic AMP accumulation. Nature 1991;351:63–65. - PubMed
    1. Xiao RP, Avdonin P, Zhou YY, Cheng H, Akhter SA, Eschenhagen T, Lefkowitz RJ, Koch WJ, Lakatta EG: Coupling of b2-adrenoceptor to Gi proteins and its physiological relevance in murine cardiac myocytes. Circ Res 1999;84:43–52. - PubMed
    1. Pines M, Santora A, Gierschik P, Menczel J, Spiegel A: The inhibitory guanine nucleotide regulatory protein modulates agonist-stimulated cAMP production in rat osteosarcoma cells. Bone Miner 1986;1:15–26. - PubMed

MeSH terms