. 2018;14(7):1226-1238.
doi: 10.1080/15548627.2018.1463121. Epub 2018 Jul 13.

Inhibiting autophagy reduces retinal degeneration caused by protein misfolding

Affiliations

Inhibiting autophagy reduces retinal degeneration caused by protein misfolding

Jingyu Yao et al. Autophagy. 2018.

Abstract

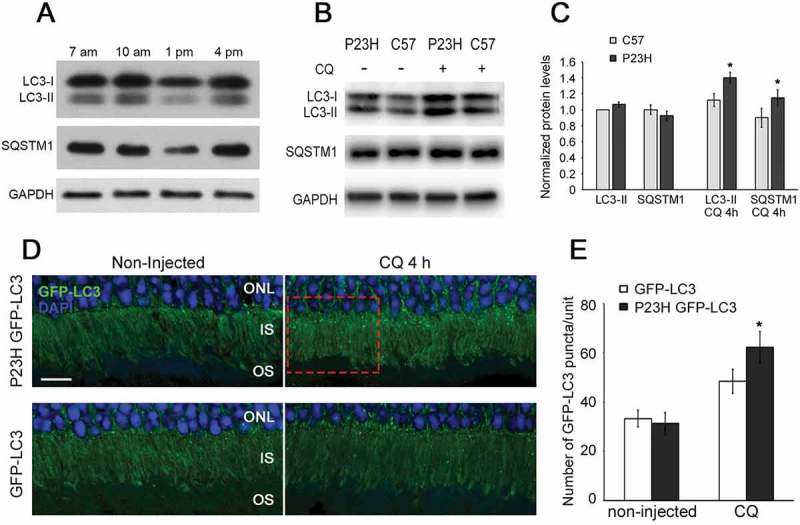
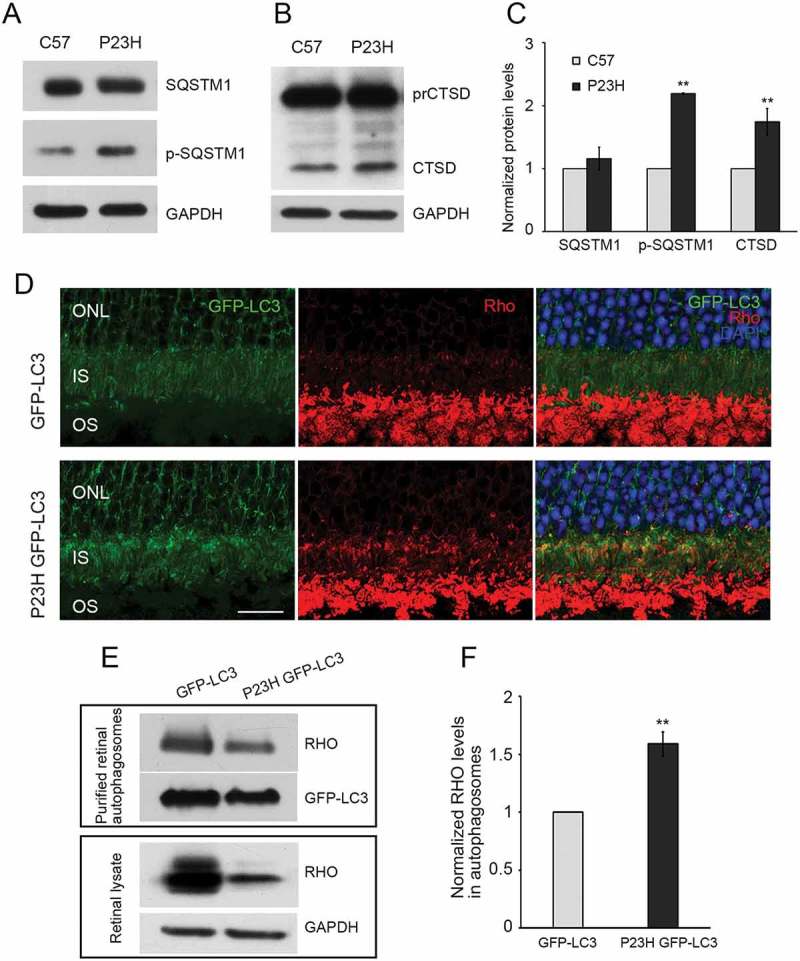
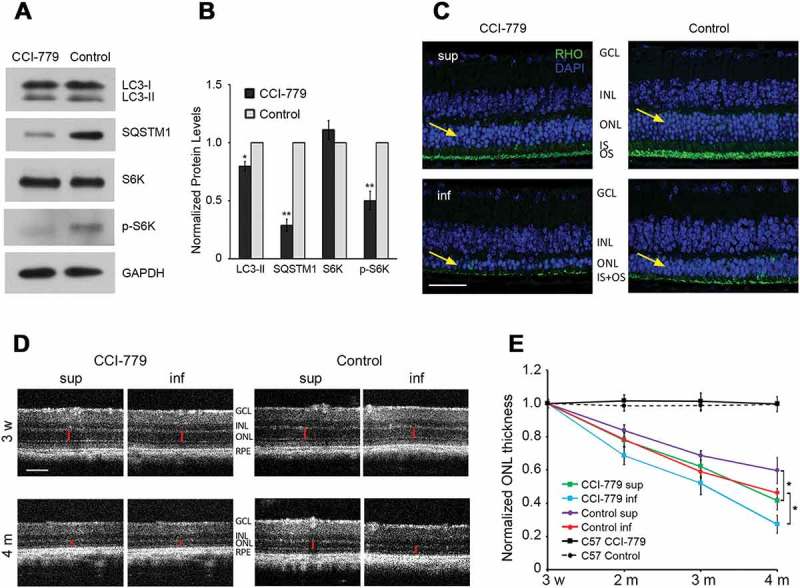
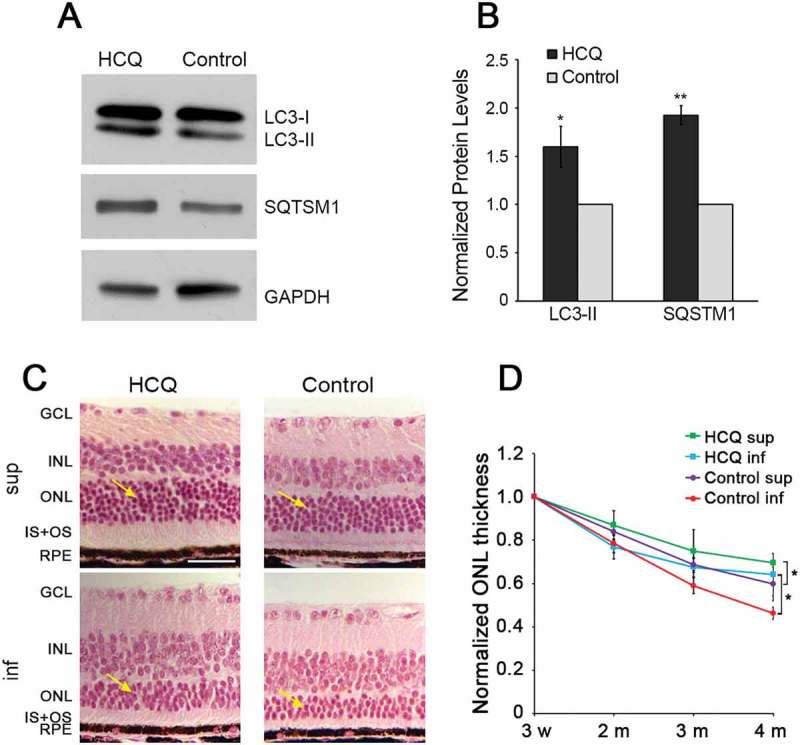
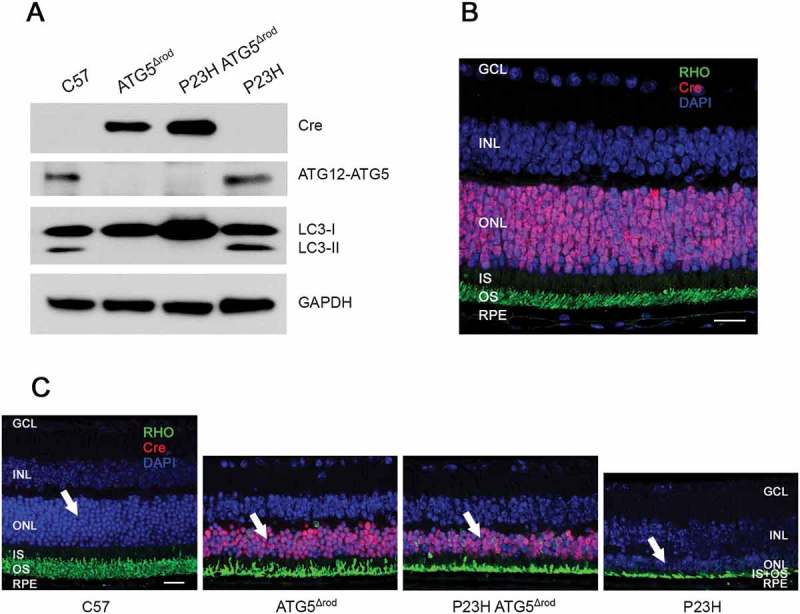
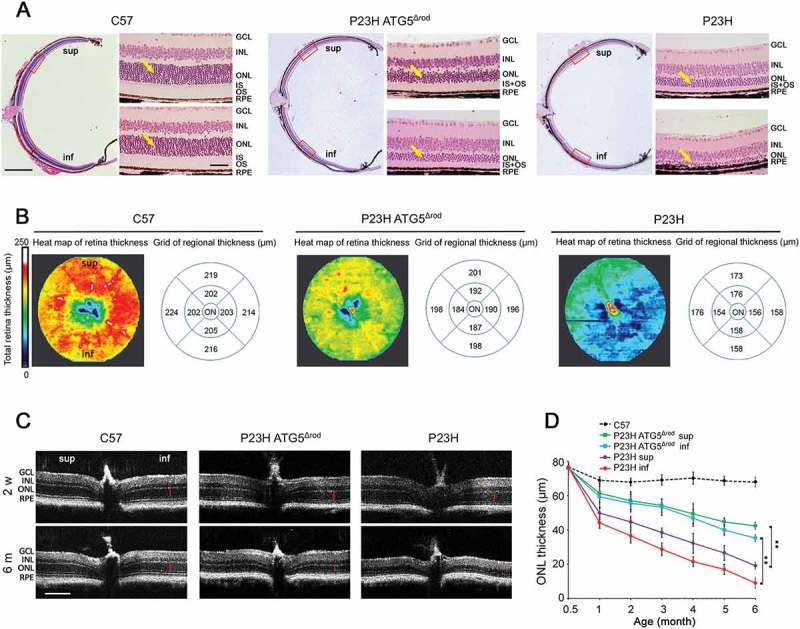
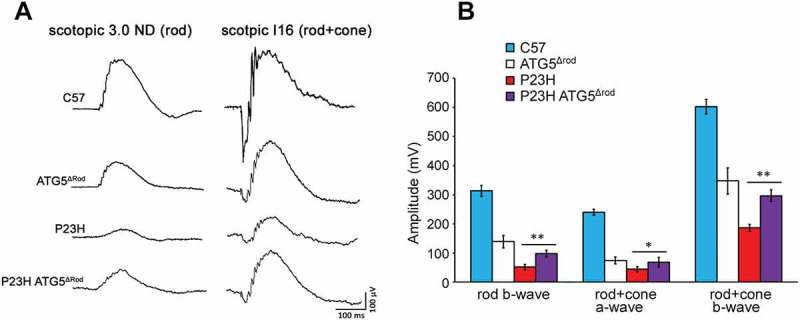
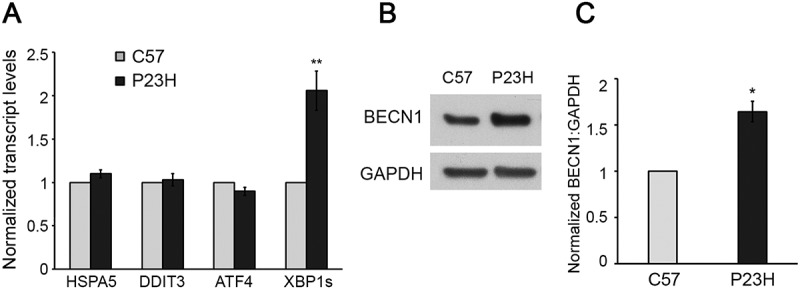
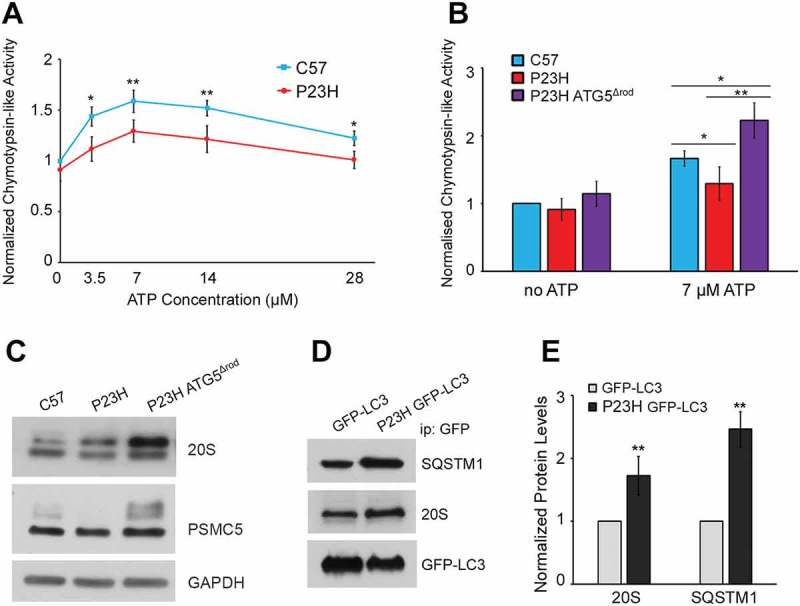
Mutations in the genes necessary for the structure and function of vertebrate photoreceptor cells are associated with multiple forms of inherited retinal degeneration. Mutations in the gene encoding RHO (rhodopsin) are a common cause of autosomal dominant retinitis pigmentosa (adRP), with the Pro23His variant of RHO resulting in a misfolded protein that activates endoplasmic reticulum stress and the unfolded protein response. Stimulating macroautophagy/autophagy has been proposed as a strategy for clearing misfolded RHO and reducing photoreceptor death. We found that retinas from mice heterozygous for the gene encoding the RHOP23H variant (hereafter called P23H) exhibited elevated levels of autophagy flux, and that pharmacological stimulation of autophagy accelerated retinal degeneration. In contrast, reducing autophagy flux pharmacologically or by rod-specific deletion of the autophagy-activating gene Atg5, improved photoreceptor structure and function. Furthermore, proteasome levels and activity were reduced in the P23H retina, and increased when Atg5 was deleted. Our findings suggest that autophagy contributes to photoreceptor cell death in P23H mice, and that decreasing autophagy shifts the degradation of misfolded RHO protein to the proteasome and is protective. These observations suggest that modulating the flux of misfolded proteins from autophagy to the proteasome may represent an important therapeutic strategy for reducing proteotoxicity in adRP and other diseases caused by protein folding defects.

Keywords: Autophagy; Rhodopsin; proteasome; protein misfolding; retinal degeneration.


Figures

Figure 1.
Figure 1.
Autophagy flux is elevated in the P23H mouse retina. (a) Retinal samples from P23H mice collected at various time points during the day, and probed with antibodies against LC3, SQSTM1, and loading control GAPDH (n = 6). (b) Western blot and (c) quantification of samples from 1-month-old P23H mice pretreated with chloroquine (CQ) or vehicle-only for 4 h, and age-matched C57BL/6J controls (C57), probed with antibodies against LC3, SQSTM1, and loading control GAPDH (n = 4). Samples collected at 1pm time point. (d) Representative fluorescence images of retinas from 1-month-old P23H GFP-LC3 and control GFP-LC3 mice not injected or injected with CQ showing a punctate pattern of GFP-LC3. The LC3 localizes primarily to the photoreceptor inner segment (IS). Photoreceptor nuclei in the outer nuclear layer (ONL) were stained with DAPI (blue). Scale bar: 10 µm. (e) Quantification of the number of GFP-LC3 puncta per counting unit indicated in (d) as a red dashed rectangle, as a measure of autophagy flux. Data are presented as mean ± SD. *, p < 0.05. N = 5.
Figure 2.
Figure 2.
Autophagy in photoreceptors of P23H mice results in increased degradation of RHO through the autophagosome-lysosome pathway. Representative western blots probed for SQSTM1, p-SQSTM1 (a), precursor CTSD (prCTSD) and mature CTSD (b) in retinas of 1-month-old P23H and control C57BL/6J (C57) mice. (c) Quantification of intensities of immunoblot bands from A and B normalized to loading control GAPDH (n = 6), with C57 values set to 1. (d) Retinal cryosections from 1-month-old GFP-LC3 and P23H GFP-LC3 mice probed for RHO (red), with DAPI staining of nuclei (blue). IS, inner segment; ONL, outer nuclear layer; OS, outer segment. Scale bar: 20 µm. (e) Immunoblot and (f) quantification of RHO levels in autophagosomes isolated from retinas of GFP-LC3 and P23H GFP-LC3 mice (E, upper panel) versus from total retinal lysate (E, lower panel). Normalization of RHO levels in the autophagosome is relative to total amount of RHO in retinal lysate, as this represents the proportion of RHO being taken up by the autophagosome (n = 4). Data are presented as mean ± SD. **, p < 0.01, unpaired t-test.
Figure 3.
Figure 3.
Increasing autophagy accelerated retinal degeneration in P23H mice. (a) MTOR inhibition and increased autophagic activity by CCI-779 was shown by representative western blots probed for LC3, SQSTM1, RPS6KB (S6K), p-RPS6KB (p-S6K), and loading control GAPDH in retinas of P23H mice after 3 months of CCI-779 treatment and control group treated with vehicle only. (b) Quantification of the bands in panel A normalized to loading control GAPDH (n = 5), with control P23H values set to 1. (c) Images of superior (sup) and inferior (inf) retina of 4-month-old CCI-779-treated P23H and control mice probed for RHO (green), with DAPI staining (blue). Yellow arrows point to the ONL, where the photoreceptor nuclei reside. Scale bar: 50µm. (d) Representative optical coherence tomography (OCT) images of superior and inferior retina of CCI-779-treated and control P23H mice at the indicated ages. OCT was used to measure the ONL thickness (red bar) of the retina in vivo. All measurements were at 500 µm from the optic nerve head. Scale bar: 100µm. GCL, ganglion cell layer; INL, inner nuclear layer; ONL, outer nuclear layer; IS, inner segment; OS, outer segment; RPE, retinal pigment epithelium. (e) Line graph showing the ONL thickness (represented by red bar in panel D) of superior and inferior retina measured by OCT for the CCI-779-treated and control group (n = 12–15). Data are presented as mean ± SD, *, p < 0.05, **, p < 0.01, unpaired t-test.
Figure 4.
Figure 4.
Decreasing autophagy by hydroxychloroquine (HCQ) treatment increased photoreceptor survival in P23H mice. (a) Representative western blots, with quantification of bands (b), probed with LC3 and SQSTM1, normalized to loading control GAPDH in retinas of P23H mice after 3 months of HCQ treatment via drinking water, with untreated P23H controls set as 1. (c) Hematoxylin and eosin (H&E) stained images of superior (sup) and inferior (inf) retina from 4-month-old HCQ-treated P23H and control mice. Retinal cell layers labeled as in Figure 3. Yellow arrows point to the ONL, where the photoreceptor nuclei reside. Scale bar: 50 µm. (d) Line graph showing the ONL thickness of superior and inferior area of the retinas, as measured by OCT at 500 µm from the optic nerve head, in the HCQ-treated P23H and control group (n = 4–16). Data presented as mean ± SD, *, p < 0.05, **, p < 0.01, unpaired t-test.
Figure 5.
Figure 5.
Genetic deletion of autophagic gene Atg5 specifically in rod photoreceptors of P23H mice to generate P23H ATG5Δrod mice. (a) Representative western blots probed for LC3, ATG12–ATG5 conjugate, SQSTM1, and loading control GAPDH from retinas of C57, ATG5Δrod, P23H ATG5Δrod, and P23H mice at 2 months of age (n = 4). (b) Retinal section from a 2-month-old P23H ATG5Δrod mouse probed for RHO (green) and Cre (red), with DAPI staining (blue). (c) Retinal sections from 6-month-old C57, ATG5Δrod, P23H ATG5Δrod, and P23H mice probed for RHO (green) and Cre (red), with DAPI staining (blue). White arrows point to the ONL, where the photoreceptor nuclei reside. Scale bar: 20 µm. Retinal cell layers labeled as in Figure 3.
Figure 6.
Figure 6.
Genetic ablation of Atg5 in rod photoreceptors of P23H mice decreased photoreceptor degeneration. (a) Representative H&E staining images of retinal paraffin sections from 6-month-old P23H ATG5Δrod and control P23H and C57 mice. High magnification images represent superior (sup) and inferior (inf) area of the retinas indicated by red rectangles in low magnification images. Yellow arrows point to the ONL, where the photoreceptor nuclei reside. Scale bar: 500 µm in the low magnification image and 50 µm in the high magnification image. (b) Heat maps of retinal thickness generated from optical coherence tomography (OCT) scans, in false colors with matching grids (diameter = 1.5 mm) centered on the optic nerve (ON). Mice were 4 months of age. sup: superior; inf: inferior. (c) Representative OCT images crossing the optic nerve from P23H ATG5Δrod and control P23H and C57 mice at the indicated ages. Red bars indicate the ONL that was measured for each mouse. Scale bar: 200 µm. (d) Line graph showing the ONL thickness (represented by red bars in panel C) of both superior and inferior retinal regions from P23H ATG5Δrod and control P23H mice measured by OCT at the indicated ages (n = 10–12). Data for C57 mice are provided for reference. Data are presented as mean ± SD, **, p < 0.01, unpaired t-test. Retinal cell layers labeled as in Figure 3.
Figure 7.
Figure 7.
Genetic ablation of Atg5 in rod photoreceptors improved photoreceptor function in P23H mice. (a) Representative electroretinogram (ERG) traces, with scotopic 3.0 ND indicating rod function, and scotopic I16 indicating mixed rod and cone functions, for P23H ATG5Δrod, control P23H, ATG5Δrod, and C57BL/6J mice at 6 months of age. (b) Quantification of peak amplitudes of rod b-wave, rod + cone a-wave, and rod + cone b-wave at 6 months of age (n = 5). Data are presented as mean ± SD; *, p < 0.05; **, p < 0.01; unpaired t-test.
Figure 8.
Figure 8.
Autophagy activation in P23H retina in response to Xbp1 mRNA splicing and increased BECN1 production. (a) Transcript levels of unfolded protein response (UPR) regulators in retinas of P23H and control C57BL/6J (C57) mice analyzed by RT-PCR (n = 6). (b and c) Representative western blots and quantification of protein levels of BECN1 (a downstream target of XBP1s) and loading control GAPDH. (n = 4). Data are presented as mean ± SD; *, p < 0.05; **, p < 0.01; unpaired t-test. All mice are 1 month old.
Figure 9.
Figure 9.
Proteasome degradation and decreased activity in the P23H mouse retina rescued by ablation of Atg5. (a) Cytosolic proteins from retinas of P23H and C57BL/6J mice assayed for proteasome peptidase activity over a range of ATP concentrations. Chymotrypsin-like activity was measured as the difference in fluorescence in the presence and absence of the specific inhibitor lactacystin (18 μM). N = 12, 2-way ANOVA. (b) Chymotrypsin-like activities of cytosolic retinal proteins without ATP or with ATP (7 µM) from P23H ATG5Δrod, P23H, and control C57BL/6J (C57) mice. (n = 8), unpaired t-test. (ab) Data were normalized to chymotrypsin-like activity of the C57BL/6J sample without ATP. (c) Western blots probed for proteasome subunits 20S and PSMC5, and loading control GAPDH, in retinas of P23H ATG5Δrod, P23H, and control C57BL/6J mice. (d) Representative western blots and (e) quantification of autophagosome contents from retinas of P23H GFP-LC3 and control GFP-LC3 mice. Blots were probed for SQSTM1, 20S, and loading control GFP-LC3. (n = 4), unpaired t-test. Data are presented as mean ± SD; *, p < 0.05; **, p < 0.01. All mice were 1 month old.

Similar articles

Cited by

References

    1. RetNet – retinal information network. Accepted on 18 September 2017 Available from: https://sph.uth.edu/retnet/
    1. Liu X, Garriga P, Khorana HG.. Structure and function in rhodopsin: correct folding and misfolding in two point mutants in the intradiscal domain of rhodopsin identified in retinitis pigmentosa. Proc Nat Acad Sci USA. 1996;93:4554–4559. - PMC - PubMed
    1. Garriga P, Liu X, Khorana HG. Structure and function in rhodopsin: correct folding and misfolding in point mutants at and in proximity to the site of the retinitis pigmentosa mutation Leu-125–&gt;arg in the transmembrane helix C. Proc Natl Acad Sci USA. 1996;93:4560–4564. - PMC - PubMed
    1. Saliba RS, Munro PM, Luthert PJ, et al. The cellular fate of mutant rhodopsin: quality control, degradation and aggresome formation. J Cell Sci. 2002;115:2907–2918. - PubMed
    1. Sohocki MM, Daiger SP, Browne SJ, et al. Prevalence of mutations causing retinitis pigmentosa and other inherited retinopathies. Hum Mutat. 2001;17:42–51. - PMC - PubMed

Publication types

MeSH terms