

Exploiting routinely collected severe case data to monitor and predict influenza outbreaks
- PMID: 29940907
- PMCID: PMC6020250
- DOI: 10.1186/s12889-018-5671-7
Exploiting routinely collected severe case data to monitor and predict influenza outbreaks
Abstract
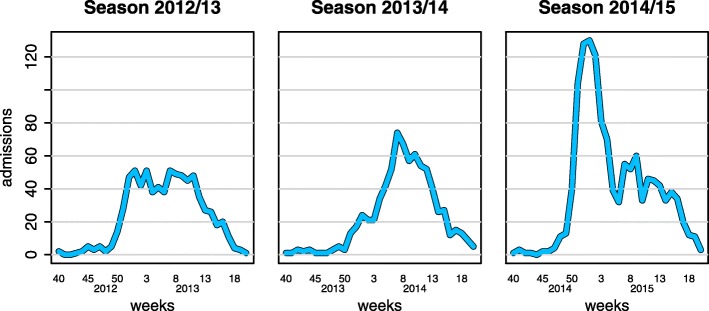
Background: Influenza remains a significant burden on health systems. Effective responses rely on the timely understanding of the magnitude and the evolution of an outbreak. For monitoring purposes, data on severe cases of influenza in England are reported weekly to Public Health England. These data are both readily available and have the potential to provide valuable information to estimate and predict the key transmission features of seasonal and pandemic influenza.
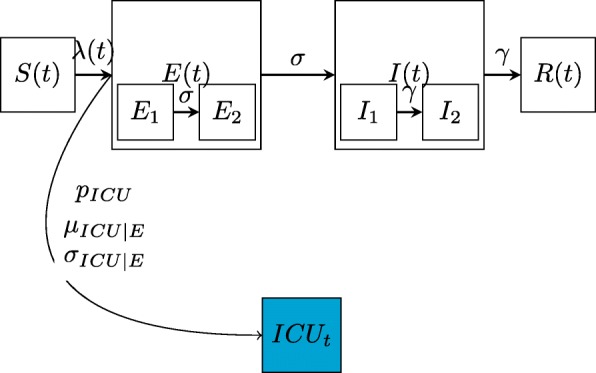
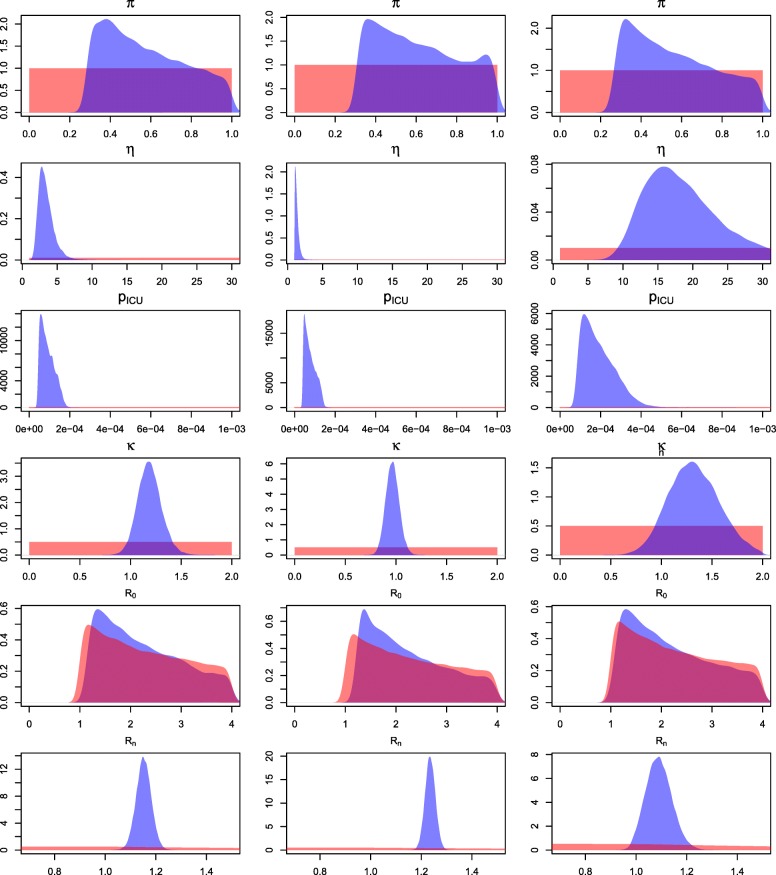
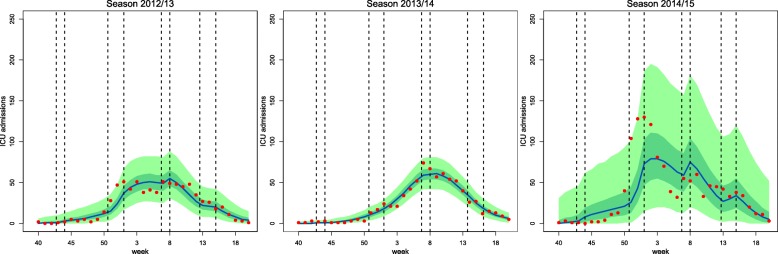
Methods: We propose an epidemic model that links the underlying unobserved influenza transmission process to data on severe influenza cases. Within a Bayesian framework, we infer retrospectively the parameters of the epidemic model for each seasonal outbreak from 2012 to 2015, including: the effective reproduction number; the initial susceptibility; the probability of admission to intensive care given infection; and the effect of school closure on transmission. The model is also implemented in real time to assess whether early forecasting of the number of admissions to intensive care is possible.
Results: Our model of admissions data allows reconstruction of the underlying transmission dynamics revealing: increased transmission during the season 2013/14 and a noticeable effect of the Christmas school holiday on disease spread during seasons 2012/13 and 2014/15. When information on the initial immunity of the population is available, forecasts of the number of admissions to intensive care can be substantially improved.
Conclusion: Readily available severe case data can be effectively used to estimate epidemiological characteristics and to predict the evolution of an epidemic, crucially allowing real-time monitoring of the transmission and severity of the outbreak.
Keywords: Bayesian inference; Epidemic models; Epidemic monitoring; Influenza; Reproduction number; Severe cases.
Conflict of interest statement
Ethics approval and consent to participate
AC accessed data held at Public Health England (PHE) as a PHE employee, under an honorary contract.
Consent for publication
Not applicable.
Competing interests
The authors declare that they have no competing interests.
Publisher’s Note
Springer Nature remains neutral with regard to jurisdictional claims in published maps and institutional affiliations.
Figures

References
-
- World Health Organization (WHO). Influenza (seasonal) fact sheet. Available from: http://www.who.int/mediacentre/factsheets/fs211/en/. Accessed Oct 2017.
-
- Matias G, Taylor R, Haguinet F, Schuck-Paim C, Lustig R, Shinde V. Estimates of mortality attributable to influenza and RSV in the United States during 1997–2009 by influenza type or subtype, age, cause of death, and risk status. Influenza Other Respir Viruses. 2014;8(5):507–15. doi: 10.1111/irv.12258. - DOI - PMC - PubMed
MeSH terms
Grants and funding
LinkOut - more resources
Full Text Sources
Other Literature Sources
Medical
