How do social-economic differences in urban areas affect tuberculosis mortality in a city in the tri-border region of Brazil, Paraguay and Argentina
- PMID: 29940908
- PMCID: PMC6019811
- DOI: 10.1186/s12889-018-5623-2
How do social-economic differences in urban areas affect tuberculosis mortality in a city in the tri-border region of Brazil, Paraguay and Argentina
Abstract
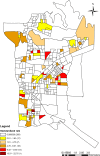
Background: The World Health Organization (WHO) launched the "End TB Strategy", which aims to reduce tuberculosis (TB) mortality by 95% by 2035, Brazil has made a commitment to this, however, one challenge is achieving the goal in the border region, where the TB situation is more critical. The proposal was to analyse the spatial mortality due to TB and its socio-economic determinants in the general population, around the border areas of Brazil, Paraguay and Argentina, as well as the temporal trend in this region.
Method: This ecological study considered the cases of TB deaths of residents of Foz do Iguaçu (BR), with its units of analysis being the census sectors. The standardized mortality rate was calculated for each area. Socioeconomic variables data were obtained from the 2010 Demographic Census of the Brazilian Institute of Geography and Statistics (IBGE). The scan statistic was applied to calculate the spatial relative risk (RR), considering a 95% confidence interval (CI). Spatial dependence was analysed using the Global Bivariate Moran I and Local Bivariate Moran I (LISA) to test the relationship between the socioeconomic conditions of the urban areas and mortality from TB. Analysis of the temporal trend was also performed using the Prais-Winsten test.
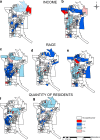
Results: A total of 74 cases of TB death were identified, of which 53 (71.6%) were male and 51 (68.9%) people of white skin colour. The mortality rate ranged from 0.28 to 22.75 cases per 100,000 inhabitants. A spatial relative risk area was identified, RR = 5.07 (95% CI 1.79-14.30). Mortality was associated with: proportion of people of brown skin colour (I: 0.0440, p = 0.033), income (low income I: - 0.0611, p = 0.002; high income I: - 0.0449, p = 0.026) and density of residents (3 and 4 residents, I: 0.0537, p = 0.007; 10 or more residents, I: - 0.0390, p = 0.035). There was an increase in the mortality rate in people of brown skin colour (6.1%; 95% CI = 0.029, 0.093).
Conclusion: Death due to TB was associated with income, race resident density and social conditions. Although the TB mortality rate is stationary in the general population, it is increasing among people of brown skin colour.
Keywords: Border crossing; Continental population group; Income; Races; Social inequity; Tuberculosis.
Conflict of interest statement
Ethics approval and consent to participate
The study was approved by the Human Research Ethics Committee of the University of São Paulo at Ribeirão Preto College of Nursing, CAAE 54499116.8.0000.5393, authorization No. 1.482.499. The Committee accepted a statement with justification for the waiver of the consent term due to the fact that the research was carried out with secondary data from the SIM and the IBGE. The Brazilian legislation regarding Resolution 466/2012 was respected.
Competing interests
The authors declare that they have no competing interests.
Publisher’s Note
Springer Nature remains neutral with regard to jurisdictional claims in published maps and institutional affiliations.
Figures


Similar articles
-
Areas with evidence of equity and their progress on mortality from tuberculosis in an endemic municipality of southeast Brazil.Infect Dis Poverty. 2017 Oct 12;6(1):134. doi: 10.1186/s40249-017-0348-5. Infect Dis Poverty. 2017. PMID: 29020981 Free PMC article.
-
Social determinants, their relationship with leprosy risk and temporal trends in a tri-border region in Latin America.PLoS Negl Trop Dis. 2018 Apr 6;12(4):e0006407. doi: 10.1371/journal.pntd.0006407. eCollection 2018 Apr. PLoS Negl Trop Dis. 2018. PMID: 29624595 Free PMC article.
-
[Juvenile homicides and informal work in a Brazilian city in the Brazil, Paraguay, and Argentina tri-border area].Rev Panam Salud Publica. 2012 May;31(5):380-7. doi: 10.1590/s1020-49892012000500005. Rev Panam Salud Publica. 2012. PMID: 22767038 Portuguese.
-
Are the neglected tropical diseases under control in the tri-border region between Brazil, Argentina, and Paraguay?J Infect Dev Ctries. 2022 Mar 31;16(3):547-556. doi: 10.3855/jidc.13613. J Infect Dev Ctries. 2022. PMID: 35404862
-
Creative health in the urban Global South: barriers and facilitators in the cases of Cochabamba and Salvador.Perspect Public Health. 2024 Sep;144(5):297-303. doi: 10.1177/17579139241288678. Epub 2024 Oct 15. Perspect Public Health. 2024. PMID: 39403958 Review.
Cited by
-
Factors associated with mortality from tuberculosis in Iran: an application of a generalized estimating equation-based zero-inflated negative binomial model to national registry data.Epidemiol Health. 2019;41:e2019032. doi: 10.4178/epih.e2019032. Epub 2019 Jul 9. Epidemiol Health. 2019. PMID: 31319655 Free PMC article.
-
Impact of socio-economic factors on Tuberculosis treatment outcomes in north-eastern Uganda: a mixed methods study.BMC Public Health. 2021 Nov 26;21(1):2167. doi: 10.1186/s12889-021-12056-1. BMC Public Health. 2021. PMID: 34836521 Free PMC article.
-
Characterisation of tuberculosis mortality in informal settlements in Nairobi, Kenya: analysis of data between 2002 and 2016.BMC Infect Dis. 2021 Jul 31;21(1):718. doi: 10.1186/s12879-021-06464-2. BMC Infect Dis. 2021. PMID: 34332534 Free PMC article.
-
Risk-prone territories for spreading tuberculosis, temporal trends and their determinants in a high burden city from São Paulo State, Brazil.BMC Infect Dis. 2022 Jun 2;22(1):515. doi: 10.1186/s12879-022-07500-5. BMC Infect Dis. 2022. PMID: 35655177 Free PMC article.
-
Tuberculosis Death Epidemiology and Its Associated Risk Factors in Sabah, Malaysia.Int J Environ Res Public Health. 2021 Sep 16;18(18):9740. doi: 10.3390/ijerph18189740. Int J Environ Res Public Health. 2021. PMID: 34574665 Free PMC article.
References
-
- World Health Organization. Global tuberculosis report 2016. http://goo.gl/vBZdPc. Accessed 20 Apr 2017.
-
- Pan American Health Organization. Tuberculosis in the Americas: regional report 2014: epidemiology, control, and financing. http://goo.gl/Zhuw7H. Accessed 20 Apr 2017.
-
- Bergonzoli G, Castellanos LG, Rodríguez R, Garcia LM. Determinants of tuberculosis in countries of Latin America and the Caribbean. Rev Panam Salud Publica. 2016;39(2):101–105. - PubMed
MeSH terms
Grants and funding
LinkOut - more resources
Full Text Sources
Other Literature Sources
Medical

