. 2018 Jun 26;49(1):53.
doi: 10.1186/s13567-018-0549-3.

A Mycobacterium avium subsp. paratuberculosis relA deletion mutant and a 35 kDa major membrane protein elicit development of cytotoxic T lymphocytes with ability to kill intracellular bacteria

Affiliations

A Mycobacterium avium subsp. paratuberculosis relA deletion mutant and a 35 kDa major membrane protein elicit development of cytotoxic T lymphocytes with ability to kill intracellular bacteria

Gaber S Abdellrazeq et al. Vet Res. .

Abstract

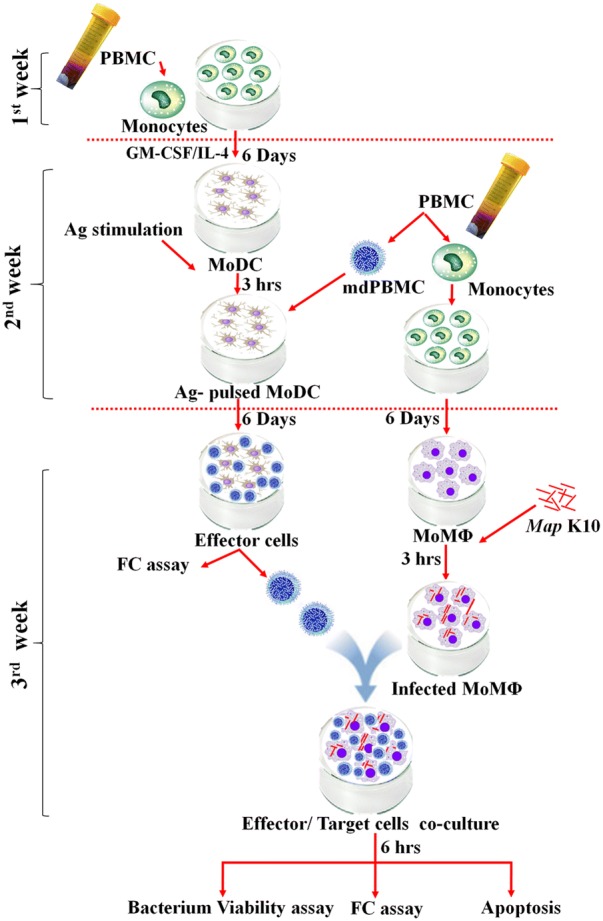
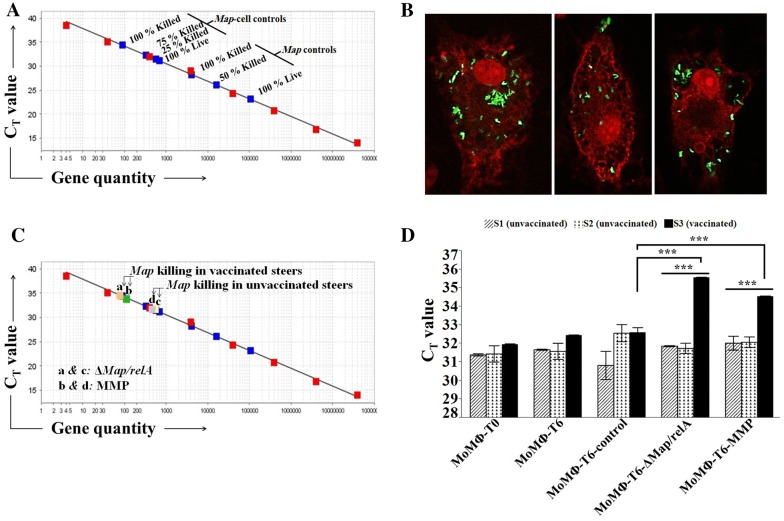
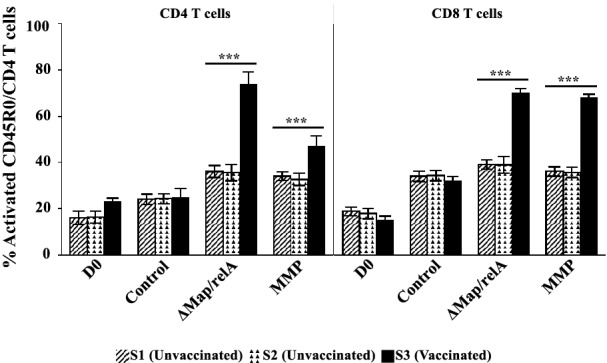
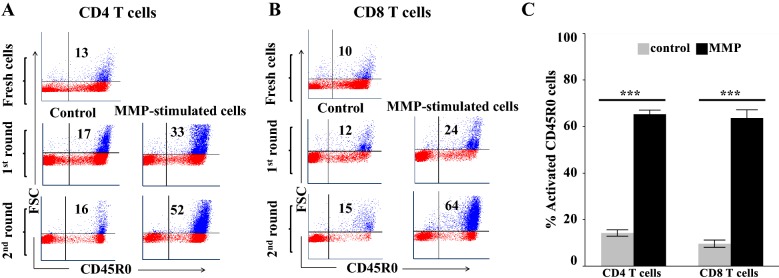
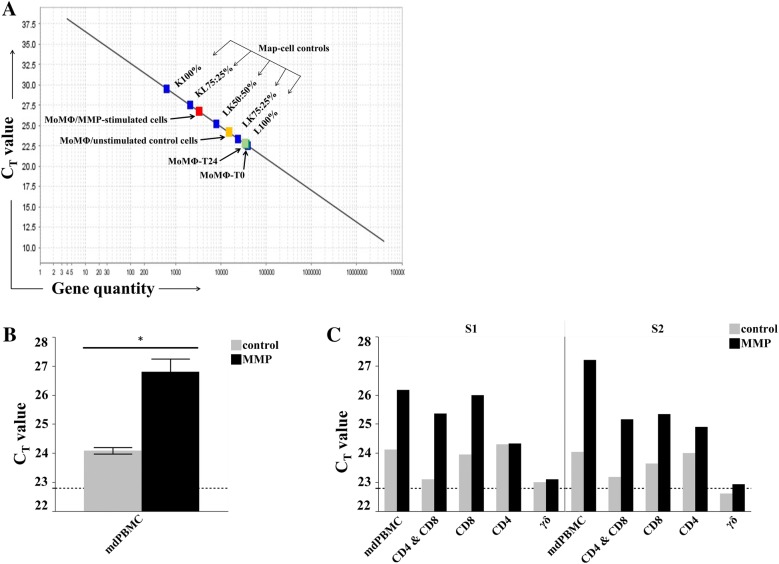
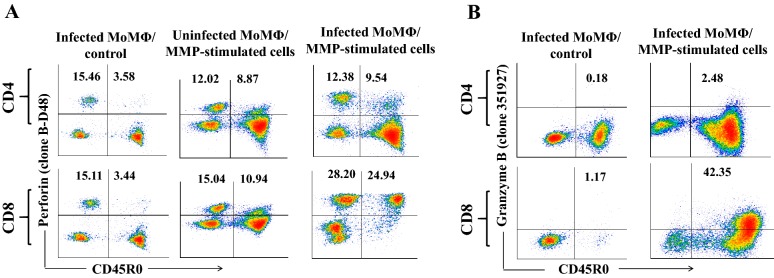
Efforts to develop live attenuated vaccines against Mycobacterium avium subspecies paratuberculosis (Map), using indirect methods to screen Map deletion mutants for potential efficacy, have not been successful. A reduction in the capacity to survive in macrophages has not predicted the ability of mutants to survive in vivo. Previous studies for screening of three deletion mutants in cattle and goats revealed one mutant, with a deletion in relA (ΔMap/relA), could not establish a persistent infection. Further studies, using antigen presenting cells (APC), blood dendritic cells and monocyte derived DC, pulsed with ΔMap/relA or a 35 kDa Map membrane protein (MMP) revealed a component of the response to ΔMap/relA was directed towards MMP. As reported herein, we developed a bacterium viability assay and cell culture assays for analysis and evaluation of cytotoxic T cells generated against ΔMap/relA or MMP. Analysis of the effector activity of responding cells revealed the reason ΔMap/relA could not establish a persistent infection was that vaccination elicited development of cytotoxic CD8 T cells (CTL) with the capacity to kill intracellular bacteria. We demonstrated the same CTL response could be elicited with two rounds of antigenic stimulation of APC pulsed with ΔMap/relA or MMP ex vivo. Cytotoxicity was mediated through the perforin granzyme B pathway. Finally, cognate recognition of peptides presented in context of MHC I and II molecules to CD4 and CD8 T cells is required for development of CTL.


Figures

Figure 1
Figure 1
Protocol for testing activity of CD4, CD8 T cells stimulated with Ag-pulsed bDC, MoDC. See “Materials and methods” for detail.
Figure 2
Figure 2
Flow cytometric gating strategy for analysis CD4, CD8 T cell response to Ag-pulsed bDC/MoDC. Gates were placed to define small lymphocytes (G1) and large activated lymphocytes (G2) and color coded blue to track activated lymphocytes. A third gate was placed on CD4 cells in this illustration to isolate activated cells for analysis. Visualization in forward scatter (FSC) vs CD45R0 (memory) shows activated cells that increase in size appear in G2. A mdPBMC cultured in medium alone for 6 days. B mdPBMC following Ag stimulation and culture for 6 days. Comparison of cells in A with B show only Ag specific CD4 memory T cells proliferated in response to stimulation with MMP. This population also expressed CD25, an indication of cells in this gate are activated (not shown). Only the activated proliferating cells in the upper right quadrant were selected for data analysis. Gated CD8 T cells had equivalent profiles.
Figure 3
Figure 3
Killing assay. A Standard curve with 8 dilutions DNA from live Map (red boxes) 4 × 107 to 4 copies. Blue square data points represent DNA from two sets of controls; the lower set of squares are from Map DNA (2 × 107 Map) prepared from mixtures of 100% live, 50% live/50% dead, and 100% dead bacteria after PMA treatment. Upper four squares are from DNA isolated from Map after 3 h incubation with MoMΦ. Squares represent mixtures of Map used to infect MoMΦ, prepared at 2 × 107 Map: 100% live, 75% live 25% dead, 25% live 75% dead and 100% dead Map. CT values represent average of duplicate preparations of DNA. B Confocal microscopy showing abundance of K10GFP taken up during 3 h incubation with MoMΦ. C Killing by effector cells plotted on standard curve from A. CT values of mdPBMC from vaccinated steer with MoDC-pulsed ΔMap/relA (a: gold box) or MMP (b: green box) and mdPBMC from one control steer stimulated with MoDC pulsed with ΔMap/relA (c: yellow box) or MMP (d: gray box). D Summary of 6 replications of killing assay comparing killing activity mdPBMC from vaccinated and control steers. Mean and standard deviation for each treatment effect (n = 6 independent experiments). Two-way ANOVA was significant (F = 88.3205; P < 0.0001) and included significant interaction effect between treatments and steer-status (F = 46.1411; P < 0.0001). Within unvaccinated steer S1 and vaccinated steer S3, mean effects of T6-∆Map/relA and T6-MMP were significantly greater than T6-control (each, P < 0.0001; ***S1 not shown). Mean effects within unvaccinated steer S2 either smaller (T6-∆Map/relA, P = 0.0027; *not shown) or not different (T6-MMP; P = 0.3668) than T6-control. Effect of T6-∆Map/relA or T6-MMP for vaccinated steer S3 was significantly greater than effect for either unvaccinated steer (each, P < 0.0001).
Figure 4
Figure 4
Two-way ANOVA comparison CD4, CD8 T cell response unvaccinated and vaccinated steers to Ag-pulsed MoDC. The factors were steer-status (three levels: S1-unvaccinated, S2-vaccinated, S3-vaccinated) and treatments (four levels: D0, Control, ∆Map/relA, MMP). Tukey HSD (overall α = 0.05) was applied post-hoc to determine the statistical significance of comparisons of interest. For each T cell type (CD4 and CD8), the mean and standard deviation for each treatment effect (n = 6 independent experiments) within each steer-status is shown. The two-way ANOVAs for CD4 and CD8 T cells were significant (FCD4 = 158.2463, FCD8 = 379.0110; each, P < 0.0001) and each included a significant interaction effect between treatments and steer-status (FCD4 = 56.3527, FCD8 = ;165.4418; each, P < 0.0001). For both CD4 and CD8 T cells, the mean effects of ∆Map/relA and MMP in vaccinated steer S3 were greater than in unvaccinated steers S1 and S2 (each, P < 0.0001); significant differences not detected between unvaccinated steers in the mean effects of ∆Map/relA (PCD4 = 1.0000, PCD8 = 1.0000) or MMP (PCD4 = 0.9997, PCD8 = 1.0000).
Figure 5
Figure 5
Comparison response CD4, CD8 T cells from unvaccinated steers stimulated with MMP-pulsed bDC and MoDC. A Representative flow cytometric profiles showing level of CD4 T cell proliferation following one and two rounds of antigenic stimulation by Ag-pulsed DC. B Representative flow cytometric profiles showing level of CD8 T cell proliferation following one and two rounds of antigenic stimulation by Ag-pulsed DC. C Two-way ANOVA with interaction. The factors were type of T cell (two levels: CD4, CD8) and MMP-stimulation (two levels: control, MMP). Tukey HSD (overall α = 0.05) was applied post-hoc to determine the statistical significance of comparisons of interest. The mean and standard deviation for each treatment effect for each type of T cell is shown (n = 4 unvaccinated steers). The two-way ANOVA was significant (F = 732.6776; P < 0.0001). The mean effect of MMP stimulation was significant (Fstimulation = 2188.613, P < 0.0001) but not dependent on T cell type (Finteraction = 1.33; P = 0.2092). The mean effect of T cell type was small but significant (CD4 effect estimate = 1.55 ± 0.56; FCD = 7.6591, P = 0.0170).
Figure 6
Figure 6
Comparison of the killing activity of CD4, CD8, and γδ T cells. A Representative set of results illustrated with the CT values obtained with unseparated cell populations. The CT values represent the average of duplicate preparations of DNA run at the same time. B A two-way ANOVA for the effect of mdPBMC stimulation (two levels: control, MMP), reponses grouped by unvaccinated steers (n = 4). The mean and standard deviation for each stimulation level (control, MMP) of mdPBMC from four unvaccinated steers. The effect of MMP stimulation was significant (Fstimulation = 130.4208; P = 0.0014). C No statistics were applied since only two of the four unvaccinated steers were used to obtain data on separated cell subsets.
Figure 7
Figure 7
Flow cytometric analysis showing expression of newly synthesized perforin, GnzB in CD4, CD8 T cells. A Newly synthesized perforin was highly expressed in CD8 T cells from unvaccinated steers with low expression in CD4 T cells (right set of graphs). Newly synthesized perforin was below the limits of detection in primed mdPBMC incubated with uninfected MoMΦ (center set of graphs). B Expression of GnzB in infected MoMΦ was low in CD4 T cells. GnzB was present in approximately half of the CD8 T cells.
Figure 8
Figure 8
Comparison of apoptosis in uninfected and infected MoMΦ incubated with MMP-stimulated mdPBMC. The frequency of apoptosis was low in infected MoMΦ incubated with naïve unprimed mdPBMC and in uninfected MoMΦ incubated with MMP-stimulated mdPBMC. Although a small increase in apoptosis was observed in infected MoMΦ incubated with MMP-stimulated mdPBMC, the majority of cells in each cell preparation were neither necrotic nor apoptotic.

References

    1. VS. UA . Johne’s disease on US dairies, 1991–2007. Washington, D.C: Animal and Plant Health Inspection Service; 2008.
    1. Singh SV, Kumar N, Sohal JS, Singh AV, Singh PK, Agrawal ND, Gupta S, Chaubey KK, Deb R, Dhama R, Rawat R. First mass screening of the human population to estimate the bio-load of Mycobacterium avium sub-species paratuberculosis in North India. JPHE. 2014;6:20–29.
    1. Singh SV, Kuenstner JT, Davis WC, Agarwal P, Kumar N, Singh D, Gupta S, Chaubey KK, Kumar A, Misri J, Jayaraman S, Sohal JS, Dhama K. Concurrent resolution of chronic diarrhea likely due to Crohn’s disease and infection with Mycobacterium avium paratuberculosis. Front Med (Lausanne) 2016;3:49. - PMC - PubMed
    1. Davis WC, Kuenstner JT, Singh SV. Resolution of Crohn’s (Johne’s) disease with antibiotics: what are the next steps? Expert Rev Gastroenterol Hepatol. 2017;11:393–396. doi: 10.1080/17474124.2017.1300529. - DOI - PubMed
    1. Sechi LA, Dow CT. Mycobacterium avium ss. paratuberculosis zoonosis—the hundred year war—beyond Crohn’s disease. Front Immunol. 2015;6:96. doi: 10.3389/fimmu.2015.00096. - DOI - PMC - PubMed

Publication types

MeSH terms

LinkOut - more resources