

Income inequalities in multimorbidity prevalence in Ontario, Canada: a decomposition analysis of linked survey and health administrative data
- PMID: 29941034
- PMCID: PMC6019796
- DOI: 10.1186/s12939-018-0800-6
Income inequalities in multimorbidity prevalence in Ontario, Canada: a decomposition analysis of linked survey and health administrative data
Abstract
Background: The burden of multimorbidity is a growing clinical and health system problem that is known to be associated with socioeconomic status, yet our understanding of the underlying determinants of inequalities in multimorbidity and longitudinal trends in measured disparities remains limited.
Methods: We included all adult respondents from four cycles of the Canadian Community Health Survey (CCHS) (between 2005 to 2011/12), linked at the individual-level to health administrative data in Ontario, Canada (pooled n = 113,627). Multimorbidity was defined at each survey response as having ≥2 (of 17) high impact chronic conditions, based on claims data. Using a decomposition method of the Erreygers-corrected concentration index (CErreygers), we measured household income inequality and the contribution of the key determinants of multimorbidity (including socio-demographic, socio-economic, lifestyle and health system factors) to these disparities. Differences over time are described. We tested for statistically significant changes to measured inequality using the slope index (SII) and relative index of inequality (RII) with a 2-way interaction on pooled data.
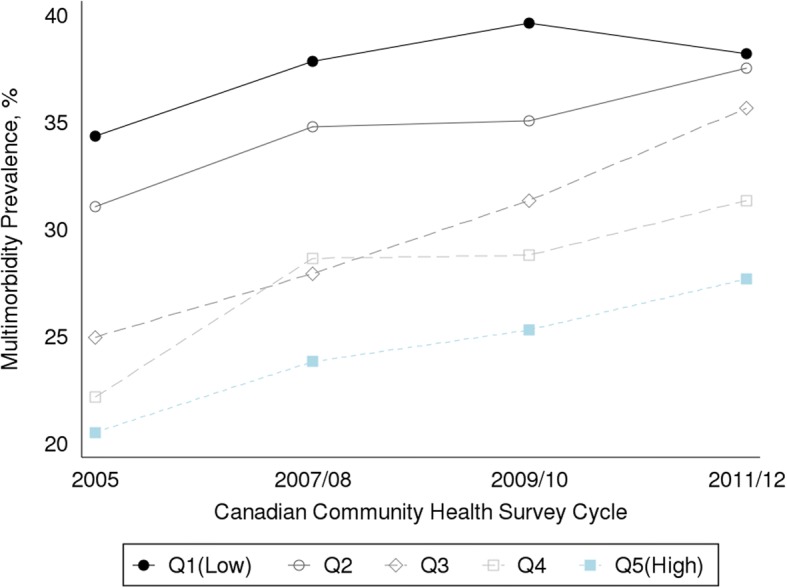
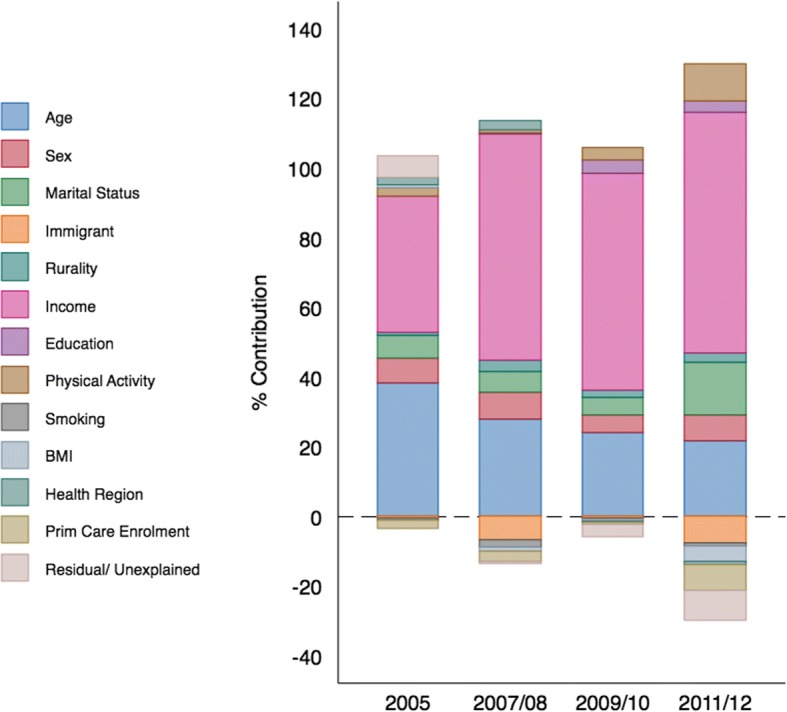
Results: Multimorbidity prevalence in 2011/12 was 33.5% and the CErreygers was - 0.085 (CI: -0.108 to - 0.062), indicating a greater prevalence among lower income groups. In decomposition analyses, income itself accounted more than two-thirds (69%) of this inequality. Age (21.7%), marital status (15.2%) and physical inactivity (10.9%) followed, and the contribution of these factors increased from baseline (2005 CCHS survey) with the exception of age. Other lifestyle factors, including heavy smoking and obesity, had minimal contribution to measured inequality (1.8 and 0.4% respectively). Tests for trends (SII/RII) across pooled survey data were not statistically significant (p = 0.443 and 0.405, respectively), indicating no change in inequalities in multimorbidity prevalence over the study period.
Conclusions: A pro-rich income gap in multimorbidity has persisted in Ontario from 2005 to 2011/12. These empirical findings suggest that to advance equality in multimorbidity prevalence, policymakers should target chronic disease prevention and control strategies focused on older adults, non-married persons and those that are physically inactive, in addition to addressing income disparities directly.
Keywords: Adult; Advance equality in multimorbidity prevalence; Chronic disease; Comorbidity; Health status disparities; Ontario/ epidemiology; Prevalence; Socioeconomic factors; Trends.
Conflict of interest statement
Ethics approval and consent to participate
We used survey data and linked health information that is routinely collected in Ontario that did not require informed consent from study participants. The use of this data was authorized under section 45 of Ontario’s Personal Health Information Protection Act, which does not require review by a Research Ethics Board.
Consent for publication
Not applicable.
Competing interests
The authors declare that they have no competing interests.
Publisher’s Note
Springer Nature remains neutral with regard to jurisdictional claims in published maps and institutional affiliations.
Figures
Similar articles
-
Changes in income-related inequalities in oral health status in Ontario, Canada.Community Dent Oral Epidemiol. 2021 Apr;49(2):110-118. doi: 10.1111/cdoe.12582. Epub 2020 Oct 12. Community Dent Oral Epidemiol. 2021. PMID: 33044034
-
Inequalities in the prevalence of diabetes mellitus and its risk factors in Sri Lanka: a lower middle income country.Int J Equity Health. 2018 Apr 17;17(1):45. doi: 10.1186/s12939-018-0759-3. Int J Equity Health. 2018. PMID: 29665834 Free PMC article.
-
Trends and Regional Variation in Prevalence of Cardiovascular Risk Factors and Association With Socioeconomic Status in Canada, 2005-2016.JAMA Netw Open. 2021 Aug 2;4(8):e2121443. doi: 10.1001/jamanetworkopen.2021.21443. JAMA Netw Open. 2021. PMID: 34410395 Free PMC article.
-
Multimorbidity of non-communicable diseases in low-income and middle-income countries: a systematic review and meta-analysis.BMJ Open. 2022 Jan 21;12(1):e049133. doi: 10.1136/bmjopen-2021-049133. BMJ Open. 2022. PMID: 35063955 Free PMC article.
-
Household and area-level social determinants of multimorbidity: a systematic review.J Epidemiol Community Health. 2021 Mar;75(3):232-241. doi: 10.1136/jech-2020-214691. Epub 2020 Nov 6. J Epidemiol Community Health. 2021. PMID: 33158940 Free PMC article.
Cited by
-
Socioeconomic gradient in mortality of working age and older adults with multiple long-term conditions in England and Ontario, Canada.BMC Public Health. 2023 Mar 11;23(1):472. doi: 10.1186/s12889-023-15370-y. BMC Public Health. 2023. PMID: 36906531 Free PMC article.
-
Inequalities in short-acting reversible, long-acting reversible and permanent contraception use among currently married women in India.BMC Public Health. 2022 Jun 28;22(1):1264. doi: 10.1186/s12889-022-13662-3. BMC Public Health. 2022. PMID: 35765061 Free PMC article.
-
Association of virtual end-of-life care with healthcare outcomes before and during the COVID-19 pandemic: A population-based study.PLOS Digit Health. 2024 Mar 13;3(3):e0000463. doi: 10.1371/journal.pdig.0000463. eCollection 2024 Mar. PLOS Digit Health. 2024. PMID: 38478533 Free PMC article.
-
Socioeconomic inequalities in prevalence and development of multimorbidity across adulthood: A longitudinal analysis of the MRC 1946 National Survey of Health and Development in the UK.PLoS Med. 2021 Sep 14;18(9):e1003775. doi: 10.1371/journal.pmed.1003775. eCollection 2021 Sep. PLoS Med. 2021. PMID: 34520470 Free PMC article.
-
Rising burden of multimorbidity and related socio-demographic factors: a repeated cross-sectional study of Ontarians.Can J Public Health. 2021 Aug;112(4):737-747. doi: 10.17269/s41997-021-00474-y. Epub 2021 Apr 13. Can J Public Health. 2021. PMID: 33847995 Free PMC article.
References
Publication types
MeSH terms
Grants and funding
LinkOut - more resources
Full Text Sources
Other Literature Sources
Medical
Miscellaneous
