. 2018 Aug 10;200(17):e00267-18.
doi: 10.1128/JB.00267-18. Print 2018 Sep 1.

Stress-Induced, Highly Efficient, Donor Cell-Dependent Cell-to-Cell Natural Transformation in Bacillus subtilis

Affiliations

Stress-Induced, Highly Efficient, Donor Cell-Dependent Cell-to-Cell Natural Transformation in Bacillus subtilis

Xiaoming Zhang et al. J Bacteriol. .

Abstract

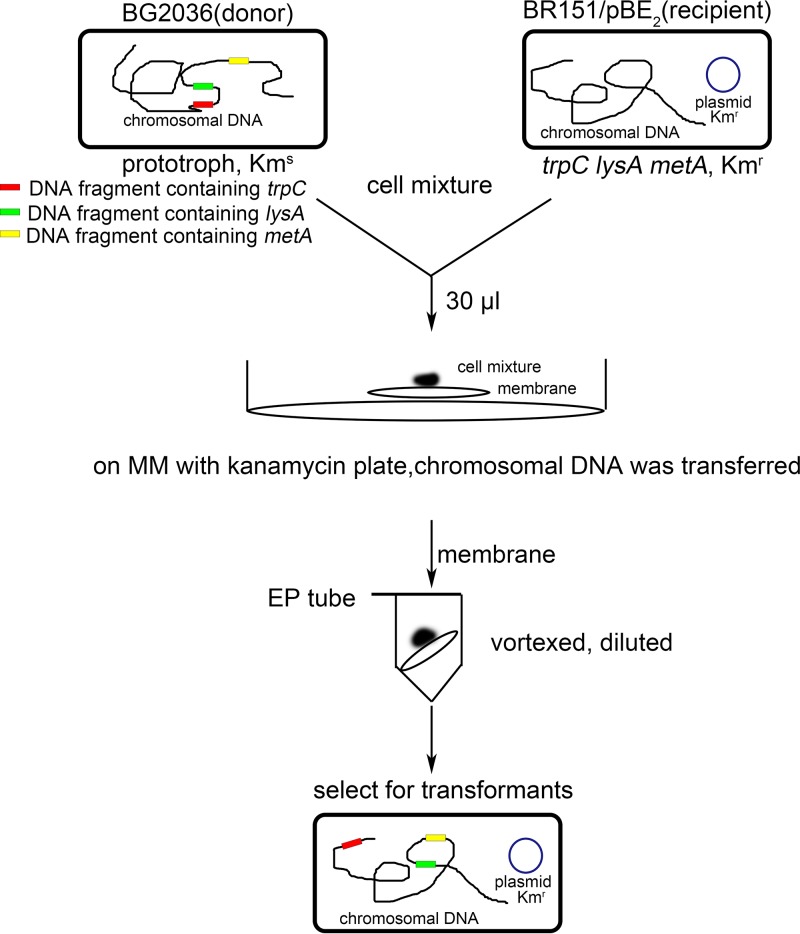
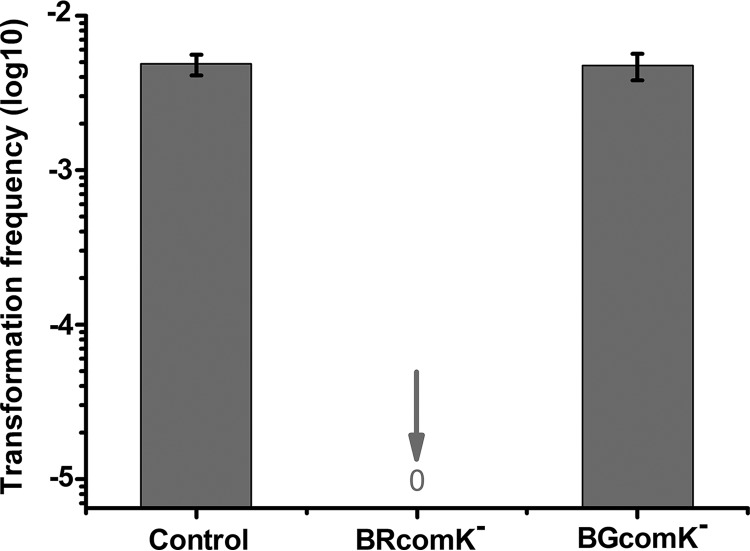
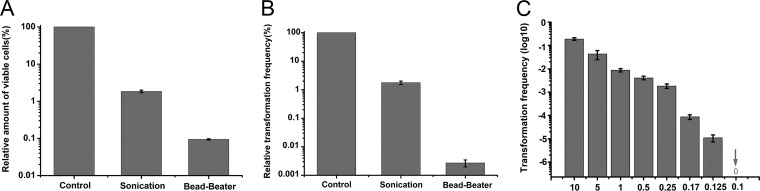
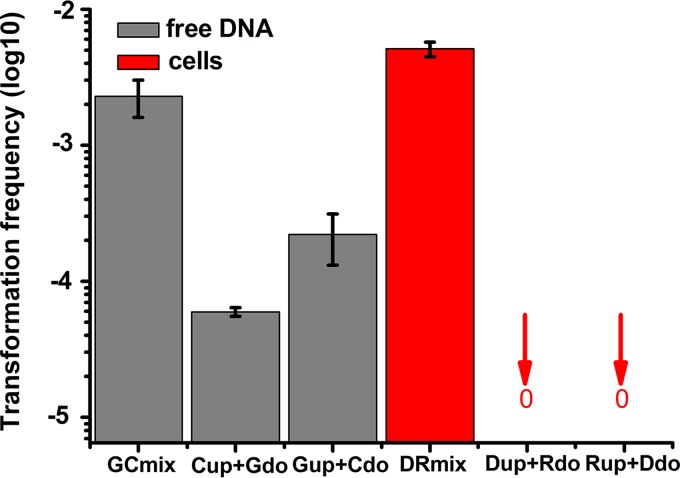
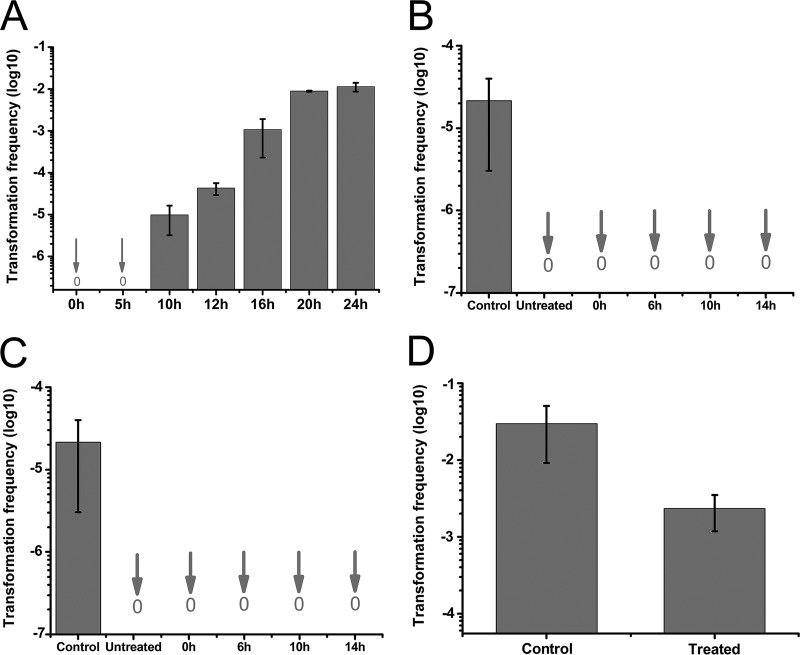
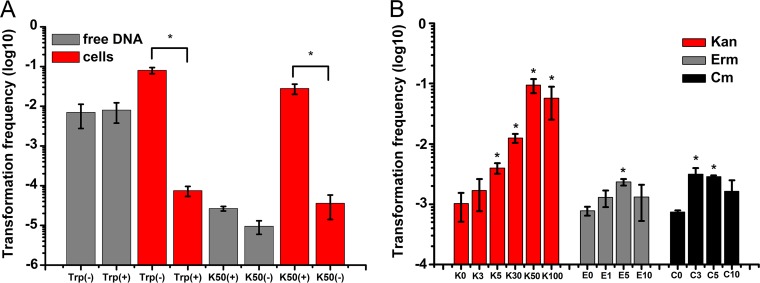
Horizontal gene transfer (HGT) is a driving force for bacterial evolution that occurs via conjugation, transduction, and transformation. Whereas conjugation and transduction depend on nonbacterial vehicles, transformation is considered a naturally occurring process in which naked DNA molecules are taken up by a competent recipient cell. Here, we report that HGT occurred between two Bacillus subtilis strains cocultured on a minimum medium agar plate for 10 h. This process was almost completely resistant to DNase treatment and appeared to require close proximity between cells. The deletion of comK in the recipient completely abolished gene transfer, indicating that the process involved transformation. This process was also highly efficient, reaching 1.75 × 10⁶ transformants/μg DNA compared to 5.3 × 10³ and 1.86 × 10⁵ transformants/μg DNA for DNA-to-cell transformation by the same agar method and the standard two-step procedure, respectively. Interestingly, when three distantly localized chromosomal markers were selected simultaneously, the efficiency of cell-to-cell transformation still reached 6.26 × 10⁴ transformants/μg DNA, whereas no transformants were obtained when free DNA was used as the donor. Stresses, such as starvation and exposure to antibiotics, further enhanced transformation efficiency by affecting the donor cells, suggesting that stress served as an important signal for promoting this type of HGT. Taken together, our results defined a bona fide process of cell-to-cell natural transformation (CTCNT) in B. subtilis and related species. This finding reveals the previously unrecognized role of donor cells in bacterial natural transformation and improves our understanding of how HGT drives bacterial evolution at a mechanistic level.IMPORTANCE Because DNA is easily prepared, studies of bacterial natural genetic transformation traditionally focus on recipient cells. However, such laboratory artifacts cannot explain how this process occurs in nature. In most cases, competence is only transient and involves approximately 20 to 50 genes, and it is unreasonable for bacteria to spend so many genetic resources on unpredictable and uncertain environmental DNA. Here, we characterized a donor cell-dependent CTCNT process in B. subtilis and related species that was almost completely resistant to DNase treatment and was more efficient than classical natural transformation using naked DNA as a donor, i.e., DNA-to-cell transformation, suggesting that DNA donor cells were also important in the transformation process in natural environments.

Keywords: Bacillus subtilis; cell-to-cell; donor cell; natural strains; natural transformation; stress.


Figures

FIG 1
FIG 1
Flow chart of the experiment. EP, Eppendorf.
FIG 2
FIG 2
The effects of comK deletion on B. subtilis cell-to-cell gene transfer. In the control experiment, comK+ strains BG2036 and BR151/pBE2 were employed as the donor and recipient, respectively. When a comK deletion mutant of BR151/pBE2 was used as the recipient, no recombinant was obtained (BRcomK). When a comK deletion mutant of BG2036 was used as the donor, the frequency of transformation was not affected (BGcomK). Error bars represent the standard deviations of the means of the results from three independent biological replicates.
FIG 3
FIG 3
Effects of viable donor cell concentration on CTCNT. (A) Effects of ultrasonication and glass bead treatment on cell viability. The relative number of viable cells was calculated as the ratio of the number of cells that survived the treatment to the number of live cells in the control group. The number of viable cells in the control group was defined as 100%. (B) Effects of ultrasonication and glass bead treatment of donor cells on transformation frequency. The relative transformation frequency was calculated similarly to the relative number of viable cells in panel A. (C) Effects of donor cell density on transformation frequency. Donor cells were concentrated or diluted as indicated on the x axis and then mixed with a fixed amount of recipient cells. The resulting transformation frequencies were compared with that obtained with the original donor culture (indicated as “1” on the x axis). The transformation frequency was correlated with the donor cell density. A 10-fold dilution of donor cells completely blocked CTCNT (arrow). Error bars represent the standard deviations of the means of the results from three independent biological replicates.
FIG 4
FIG 4
Close proximity between donor and recipient cells appeared to be required for CTCNT. Transformation assays were performed with strains BG2036 and BR151/pBE2. When free DNA was used as the donor, recombinants were selected on MM plates with kanamycin, lysine, and tryptophan. When donor cells were used, recombinants were selected on MM plates with kanamycin. GCmix, free DNA and recipient cells were mixed on the top of the membrane; Cup+Gdo, recipient cells were on top of the membrane, and free DNA was under the membrane; Gup+Cdo, free DNA was on top of the membrane, and recipient cells were under the membrane; DRmix, donor cells were mixed with recipient cells on top of the membrane; Dup+Rdo, donor cells were on top of the membrane, and recipient cells were under the membrane; Rup+Ddo, recipient cells were on top of the membrane, and donor cells were under the membrane. Error bars represent the standard deviations of the means of the results from three independent biological replicates.
FIG 5
FIG 5
CTCNT was a coordinated process. (A) Influence of incubation time on the frequency of CTCNT between strains BG2036 and BR151/pBE2. Mixed donor and recipient cells were incubated on the filter membrane for different times before being washed off the membrane and selected for recombinants. (B) Pretreatment of donor cells before mixing with untreated recipient cells did not result in CTCNT. The indicated conditions (0, 6, 10, and 14 h) represent durations of pretreatment of donor cells on MM containing kanamycin before being washed off the membrane and mixed with a fixed volume of untreated recipient cells. In each case, we incubated the mixed cells for 40 min in the liquid and then diluted them 10-fold (to avoid secondary transformation on the agar plate) before spreading them on the selective medium. The “untreated” group represents untreated donor cells (cultured in liquid LB medium for 6 h, as described in Materials and Methods) directly mixed with untreated recipient cells (cultured in liquid MM for 11 h, as described in Materials and Methods) for 40 min in the liquid. The group in which the donor and recipient cells were incubated together for about 10 h on the agar plate was indicated as the control. (C) Pretreatment of both donor and recipient cells before mixing did not result in CTCNT. The control group is the same as that in panel B. The indicated conditions (untreated, 0 h, 6 h, 10 h, and 14 h) represent the same conditions as in panel B, except that the recipients were competent cells prepared by a two-step method. The “untreated” group represents untreated donor cells directly mixed with competent cells for 40 min in the liquid. (D) Pretreatment of recipient cells to induce competence before mixing with untreated donor cells did not enhance the frequency of CTCNT. Untreated or competent BR151/pBE2 cells prepared by a two-step method were mixed with donor cells on the agar plate for 24 h, and recombinants were selected on MM plates with kanamycin. Error bars represent the standard deviations of the means of the results from three independent biological replicates.
FIG 6
FIG 6
The frequency of CTCNT was significantly enhanced by stress. (A) Impact of starvation or exposure to antibiotics on the frequency of CTCNT. The indicated conditions represent the conditions of the incubation period, not the selective plates used to obtain recombinants. Donor cells of strain 168 or chromosomal DNA of strain 168 were mixed with recipient cells of strain DB104 on a filter membrane placed on MM without tryptophan [Trp(−)] or MM with tryptophan [Trp(+)] plates. The selection medium was MM. To test the influence of antibiotics on CTCNT, a similar experiment was performed with strain IA6 ΔcomK or its chromosomal DNA as the donor and strain BR151/pBE2 as the recipient on MM with tryptophan plus kanamycin [K50(+)] or with tryptophan [K50(−)]. The selection medium was MM agar with tryptophan and kanamycin. Error bars represent the standard deviations of the means of the results from three independent biological replicates. Significance was determined by Student's t tests, as indicated by asterisks (P < 0.05). (B) Antibiotics increased the frequency of CTCNT in a concentration-dependent manner. Donor IA6 ΔcomK cells and recipient BR151/pBE2 cells were mixed on a membrane placed on MM agar with tryptophan containing different concentrations of the indicated antibiotics (kanamycin [0, 3, 5, 30, 50, 100 μg/ml], represented by [K0, K3, K5, K30, K50, and K100, respectively]; erythromycin [0, 1, 5, 10 μg/ml], represented by [E0, E1, E5, and E10, respectively]; and chloramphenicol [0, 3, 5, 10 μg/ml], represented by [C0, C3, C5, and C10, respectively]). The selection medium was MM with tryptophan and the corresponding antibiotics (at the MIC). Error bars represent the standard deviations of the means of the results from three independent biological replicates. Significant differences compared with the controls without antibiotics (K0, E0, and C0), as determined by Student's t tests, are indicated by asterisks (P < 0.05).
FIG 7
FIG 7
CTCNT between different bacterial species. (A) CTCNT occurred between different B. subtilis strains. The combinations tested included strains BG2036 and BR151/pBE2 (GR), BG2036 and DB104/pBE2 (GD), DB104 and BR151/pBE2 (DR), BN13 and DB104/pBE2 (N1D), BN13 and BR151/pBE2 (N1R), BN46 and DB104/pBE2 (N4D), and BN46 and BR151/pBE2 (N4R). The natural B. subtilis strains FJAT-10275 (F10), FJAT-13833 (F13), FJAT-47051 (F47), FJAT-5545 (F55), and FJAT-7148 (F71) were used as donors with strain BR151/pBE2 as the recipient to test CTCNT between laboratory and natural strains. (B) CTCNT occurred between B. subtilis and its relative B. licheniformis. B. licheniformis strains WX-03 (C2), WX-04 (C4), and WX-05 (C6) were employed as donors to mix with B. subtilis strain 168 ΔhisD/pBE2 for CTCNT. As a control, chromosomal DNA from the B. licheniformis strains was used as the donor. Black bars represent the transformation frequency when donor cells were used as the source of DNA. Gray bars represent the transformation frequency when the corresponding free DNA was the donor. Error bars represent the standard deviations of the means of the results from three independent biological replicates.

Similar articles

Cited by

References

    1. Stewart GJ, Carlson CA. 1986. The biology of natural transformation. Annu Rev Microbiol 40:211–235. doi:10.1146/annurev.mi.40.100186.001235. - DOI - PubMed
    1. Chen I, Dubnau D. 2004. DNA uptake during bacterial transformation. Nat Rev Microbiol 2:241–249. doi:10.1038/nrmicro844. - DOI - PubMed
    1. Chen I, Christie PJ, Dubnau D. 2005. The ins and outs of DNA transfer in bacteria. Science 310:1456–1460. doi:10.1126/science.1114021. - DOI - PMC - PubMed
    1. Claverys JP, Martin B, Polard P. 2009. The genetic transformation machinery: composition, localization, and mechanism. FEMS Microbiol Rev 33:643–656. doi:10.1111/j.1574-6976.2009.00164.x. - DOI - PubMed
    1. Johnsborg O, Eldholm V, Havarstein LS. 2007. Natural genetic transformation: prevalence, mechanisms and function. Res Microbiol 158:767–778. doi:10.1016/j.resmic.2007.09.004. - DOI - PubMed

Publication types

LinkOut - more resources