Comparative Study
. 2018 Sep;24(9):1119-1132.
doi: 10.1261/rna.062802.117. Epub 2018 Jun 25.

Biological classification with RNA-seq data: Can alternatively spliced transcript expression enhance machine learning classifiers?

Affiliations
Comparative Study

Biological classification with RNA-seq data: Can alternatively spliced transcript expression enhance machine learning classifiers?

Nathan T Johnson et al. RNA. 2018 Sep.

Abstract

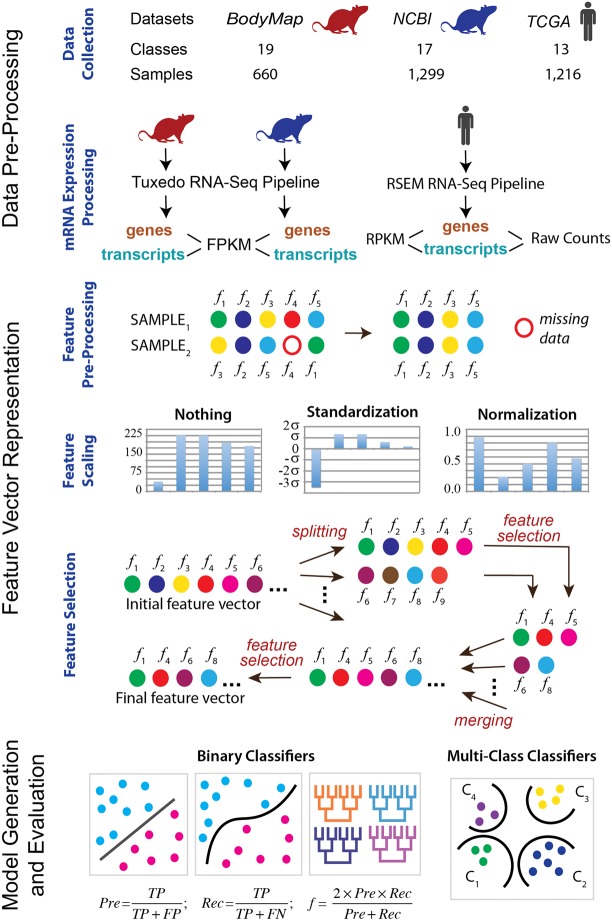
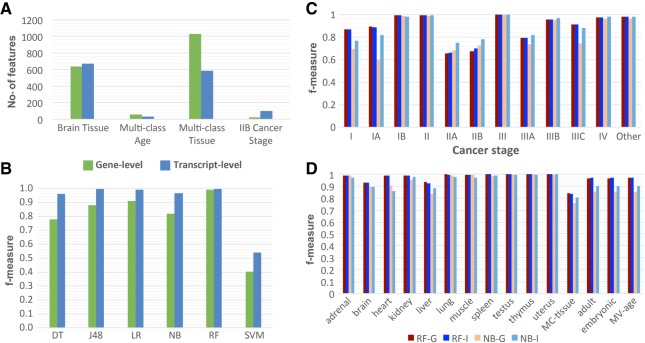
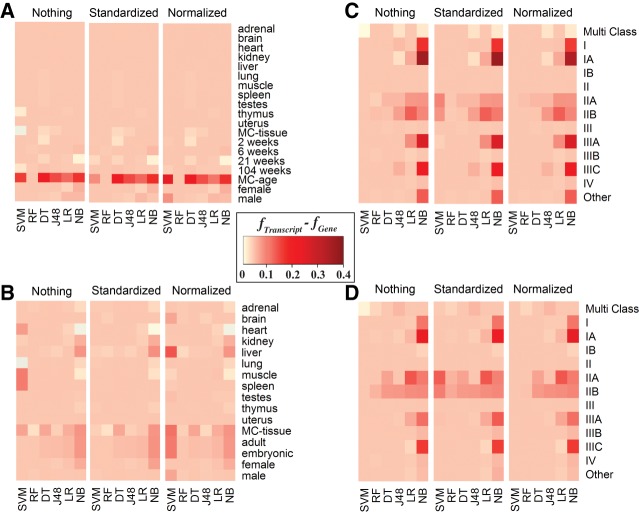
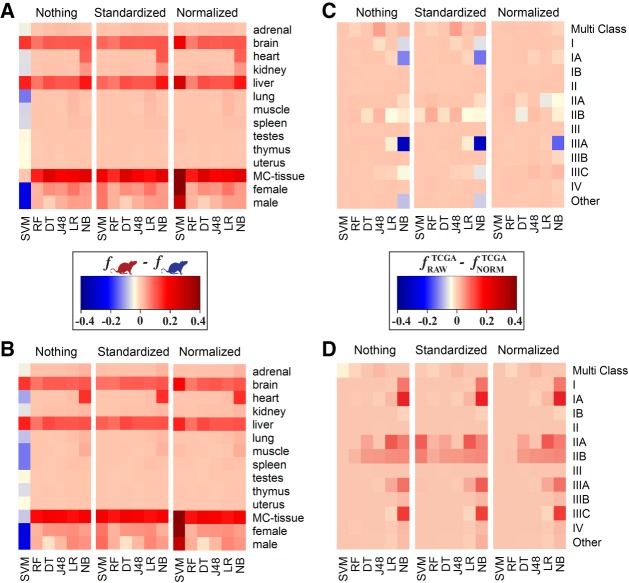
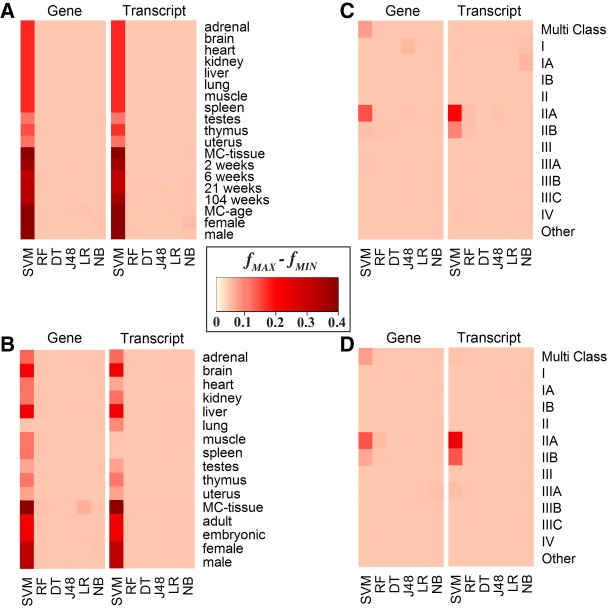
RNA sequencing (RNA-seq) is becoming a prevalent approach to quantify gene expression and is expected to gain better insights into a number of biological and biomedical questions compared to DNA microarrays. Most importantly, RNA-seq allows us to quantify expression at the gene or transcript levels. However, leveraging the RNA-seq data requires development of new data mining and analytics methods. Supervised learning methods are commonly used approaches for biological data analysis that have recently gained attention for their applications to RNA-seq data. Here, we assess the utility of supervised learning methods trained on RNA-seq data for a diverse range of biological classification tasks. We hypothesize that the transcript-level expression data are more informative for biological classification tasks than the gene-level expression data. Our large-scale assessment utilizes multiple data sets, organisms, lab groups, and RNA-seq analysis pipelines. Overall, we performed and assessed 61 biological classification problems that leverage three independent RNA-seq data sets and include over 2000 samples that come from multiple organisms, lab groups, and RNA-seq analyses. These 61 problems include predictions of the tissue type, sex, or age of the sample, healthy or cancerous phenotypes, and pathological tumor stages for the samples from the cancerous tissue. For each problem, the performance of three normalization techniques and six machine learning classifiers was explored. We find that for every single classification problem, the transcript-based classifiers outperform or are comparable with gene expression-based methods. The top-performing techniques reached a near perfect classification accuracy, demonstrating the utility of supervised learning for RNA-seq based data analysis.

Keywords: RNA-seq; alternative splicing; classification; gene expression; machine learning.


Figures

FIGURE 1.
FIGURE 1.
Overall computational pipeline used in this work. The samples from each of the three data sets are collected. The classification tasks are then defined. The expression data are processed for each sample at the gene and isoform levels using two RNA processing pipelines and three different count measures. Next, feature preprocessing, scaling, and selection are done for each classification task. Finally, the binary as well as multiclass supervised classifiers are trained and tested.
FIGURE 2.
FIGURE 2.
Overview of feature selection and the performance of classifiers using gene and isoform level expression data. (A) Comparison of the number of features between gene and isoform after feature selection. Each classification task has the same number of features selected for each classifier at the gen-level and isoform-level. The four selected classes represent the four types of patterns seen between gene-level (green) and isoform-level classifiers. The brain tissue class is the most common pattern of feature selection. In general, more features are selected for isoform-level classifiers versus gene-level. (B) Example of the variability of gene and isoform performance determined by f-measure across the six methods ([DT] Decision Table, [J48] J48 Decision Tree, [LR] Linear Regression, [NB] Naïve Bayes, [RF] Random Forest, [SVM] Support Vector Machine). This example is from the RBM data set for the Multi Age class without normalization. While there is a high degree of variability in performance, isoform-level classifiers consistently perform either comparably or better than gene-level classifiers. (C,D) Summary of the performance variability across classes for gene and isoform f-measure for the most frequent top and bottom performance methods ([RF-G] Random Forest Gene, [RF-I] Random Forest Isoform, [NB-G] Naïve Bayes Gene, [NB-I] Naïve Bayes Isoform). The data used in C is TCGA data set and in D is NCBI data set. MC stands for multiclass.
FIGURE 3.
FIGURE 3.
Heat map representation of the difference between Isoform and Gene f-measure across machine learning methods, classes, data sets, and normalization techniques. For the majority of classification tasks, using isoform-level rather than gene-level expression data resulted in a small to substantial increase of the performance accuracy, represented by f-measure values here. The bottom x-axis represents the machine learning techniques ([DT] Decision Table, [J48] J48 Decision Tree, [LR] Linear Regression, [NB] Naïve Bayes, [RF] Random Forest, [SVM] Support Vector Machine). The y-axis represents the classes considered. MC stands for multiclass. The top x-axis represents normalization techniques including Nothing (no normalization), Standardized, and Normalized. Data sets for each panel are (A) RBM, (B) NCBI, (C) TCGA–log2 normalized counts, and (D) TCGA–raw counts.
FIGURE 4.
FIGURE 4.
Heat map representation showing the influence of different factors on the accuracy performance. Panels A and B represent the difference in performance accuracies, calculated with f-measure, between RBM (single-lab) and NCBI (multi-lab) data sets for gene-based (A) and isoform-based (B) classifications, respectively. Panels C and D represent the difference in f-measure between the classifiers trained on the TCGA expression values, quantified as either raw counts or log2 normalized counts with respect to gene length and sequencing depth. Shown are f-measure differences for gene-based (C) and isoform-based (D) classifications, respectively. The bottom x-axis represents the machine learning techniques ([DT] Decision Table, [J48] J48 Decision Tree, [LR] Linear Regression, [NB] Naïve Bayes, [RF] Random Forest, [SVM] Support Vector Machine). The y-axis represents the classes considered. MC stands for multiclass. The top x-axis represents normalization techniques including Nothing (no normalization), Standardized, and Normalized.
FIGURE 5.
FIGURE 5.
Heat map representation of the difference between maximum f-measure and minimum f-measure across normalization techniques. To demonstrate the variability attributed to the machine learning normalization technique, the intensity of the color represents the difference between the maximum and minimum f-measures achieved for a specific classification task and specific classifier across all three normalization protocols. The upper x-axis reflects if the difference is from gene or isoform expression values. SVM is the only method that has significant changes due to normalization. The lower x-axis represents machine learning techniques ([DT] Decision Table, [J48] J48 Decision Tree, [LR] Linear Regression, [NB] Naïve Bayes, (RF) Random Forest, [SVM] Support Vector Machine). The y-axis represents the classes considered. MC stands for multiclass. Data sets for each panel are (A) RBM, (B) NCBI, (C) TCGA–log2 normalized counts, and (D) TCGA–raw counts.

References

    1. Achim K, Pettit JB, Saraiva LR, Gavriouchkina D, Larsson T, Arendt D, Marioni JC. 2015. High-throughput spatial mapping of single-cell RNA-seq data to tissue of origin. Nat Biotechnol 33: 503–509. - PubMed
    1. Alamancos GP, Pagès A, Trincado JL, Bellora N, Eyras E. 2015. Leveraging transcript quantification for fast computation of alternative splicing profiles. RNA 21: 1521–1531. - PMC - PubMed
    1. Asur S, Raman P, Otey ME, Parthasarathy S. 2006. A model-based approach for mining membrane protein crystallization trials. Bioinformatics 22: e40–e48. - PubMed
    1. Barbosa-Morais NL, Irimia M, Pan Q, Xiong HY, Gueroussov S, Lee LJ, Slobodeniuc V, Kutter C, Watt S, Colak R, et al. 2012. The evolutionary landscape of alternative splicing in vertebrate species. Science 338: 1587–1593. - PubMed
    1. Boulesteix AL, Janitza S, Kruppa J, König IR. 2012. Overview of random forest methodology and practical guidance with emphasis on computational biology and bioinformatics. Wiley Interdiscip Rev Data Min Knowl Discov 2: 493–507.

Publication types

LinkOut - more resources