. 2018 Sep 3;217(9):3109-3126.
doi: 10.1083/jcb.201802027. Epub 2018 Jun 25.

The molecular recognition of phosphatidic acid by an amphipathic helix in Opi1

Affiliations

The molecular recognition of phosphatidic acid by an amphipathic helix in Opi1

Harald F Hofbauer et al. J Cell Biol. .

Abstract

A key event in cellular physiology is the decision between membrane biogenesis and fat storage. Phosphatidic acid (PA) is an important intermediate at the branch point of these pathways and is continuously monitored by the transcriptional repressor Opi1 to orchestrate lipid metabolism. In this study, we report on the mechanism of membrane recognition by Opi1 and identify an amphipathic helix (AH) for selective binding of PA over phosphatidylserine (PS). The insertion of the AH into the membrane core renders Opi1 sensitive to the lipid acyl chain composition and provides a means to adjust membrane biogenesis. By rational design of the AH, we tune the membrane-binding properties of Opi1 and control its responsiveness in vivo. Using extensive molecular dynamics simulations, we identify two PA-selective three-finger grips that tightly bind the PA phosphate headgroup while interacting less intimately with PS. This work establishes lipid headgroup selectivity as a new feature in the family of AH-containing membrane property sensors.


Figures

Figure 1.
Figure 1.
Opi1 uses an AH to control glycerophospholipid metabolism. (A and B) PA serves as a precursor for diacylglycerol (DAG) and triacylglycerol (TAG). Via cytidine diphosphate (CDP)-DAG, PA can also be converted in various other glycerophospholipids. When the level of PA is high, Opi1 binds to the ER membrane, thereby facilitating membrane biogenesis (A). When the PA level is low, Opi1 localizes to the nucleus and represses its target genes (B). Scs2 acts a coreceptor for Opi1. Inlets show micrographs Opi1-mGFP–expressing cells with Elo3-mRFP as ER marker. Bars, 5 µm. (C) Domain organization of Opi1 (404 aa) with the PA-interacting motif (aa 109–138; light blue), the leucine zipper motif (aa 139–160; brown), and the FFAT motif (aa 193–204; green) for Scs2 binding is schematically indicated. The nuclear localization sequence (aa 109–112) and the PA-binding domain are highlighted (aa 111–128). (D) Visualization of the putative AH (Opi1111–128) using HeliQuest and PyMOL. (E) CD spectroscopic analysis of the Opi1111–128 synthetic peptide in a sodium phosphate buffer in the absence of detergent (buffer) or in the presence of either 20 mM DDM or 20 mM SDS. MRE, mean residue ellipticity.
Figure 2.
Figure 2.
The AH of Opi1 senses PA, lipid packing, and membrane curvature. (A) CD spectral analysis of the Opi1111–128 synthetic peptide in the presence of extruded PC-based liposomes containing different molar fractions of the indicated anionic lipids. (B) The indicated MBP-Opi1 fusion constructs were affinity purified and analyzed by SEC. The void volume (V0) of the Superdex 200 Increase 10/300 column was 8.9 ml. (C) Indicated MBP-Opi1 variants were incubated with liposomes containing different PA concentrations. After LF, the discontinuous sucrose gradient was fractionated, and the samples were subjected to SDS-PAGE. (D) The liposome-bound fraction Opi1 was determined for the indicated liposomes in plotted in a bar diagram. Data points represent the average of three independent experiments except for the 0% PA/PS and 40% PS conditions (n = 9) and the 20% PA conditions (n = 11). Error bars represent SD. Asterisks indicate significant differences: ***, P < 0.01. (E) Schematic illustration of the impact of membrane curvature and the unsaturation degree of lipid acyl chains on the frequency of interfacial voids (arrows). (F) The binding of MBP-Opi1180* to different liposomal preparations was analyzed. The proportion of monounsaturated lipid acyl chains (MUFA content) was varied by mixing the indicated lipids, and the liposomal diameter was modified by extrusion through filters with indicated pore sizes. Dashed lines highlight the role of membrane curvature. Data are given as average of at least three independent experiments with the error bars representing the SD.
Figure 3.
Figure 3.
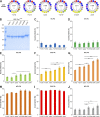
Interfacial hydrophobicity tuning affects membrane binding of MBP-Opi1R180*. (A) Helical wheel representations of different MBP-Opi1R180* variants using HeliQuest. (B) The indicated MBP-Opi1R180* variants were purified by a two-step purification protocol. 1 µg of each protein was subjected to SDS-PAGE for quality control. (C–J) Opi1 binding assays to liposomes containing increasing proportions of POPA (C–I) or 40 mol% POPS (J) as performed for Fig. 2 C. The data show the average of two (C, H, and I) and three (D–G and J) independent experiments. Values for the native MBP-Opi1R180* variant with 0% PA, 20% PA, and 40% PS are derived from 9, 11, and 9 independent experiments, respectively, and are identical to the data represented in Fig. 2 D. Error bars represent SD. Asterisks indicate significantly perturbed binding compared with the native protein variant: *, P < 0.1; **, P < 0.05; ***, P < 0.01. Significance tests were not conducted for C, H, and I (n = 2).
Figure 4.
Figure 4.
In vivo validation of interfacial hydrophobicity tuning. (A) Chromosomally integrated Opi1-mGFP variants were spotted on solid media either containing (+Ino) or lacking inositol (−Ino) at the indicated temperatures and scanned after 2 d cultivation. (B) Representative micrographs of live cells expressing Opi1-mGFP variants cultivated on inositol-containing liquid media or for 2 h after inositol depletion. Bars, 5 µm. DIC, differential interference contrast. (C) Phenotypical characterization of the indicated Opi1-mGFP variants. The average growth rate in liquid medium lacking inositol between 3 and 6 h inositol depletion from three independent experiments is plotted with the error bars representing the SD. The Opi phenotype was used to monitor secretion of inositol apparent as a red halo around a spotted colony. Steady-state levels of the MBP-Opi1R180* variants in the lysates of cells cultivated for 2 h in inositol-lacking media were analyzed by immunoblotting. Opi1-mGFP was detected using an anti-GFP antibody with anti-Pgk1 antibody as internal control. (D) Automated quantification of micrographs from B. The localization index is a semiquantitative measure for the subcellular localization of the indicated Opi1-mGFP variants. A localization index <1.3 indicates a nuclear localization, and a localization index >1.3 indicates ER localization. The data points are based on four independent replicates with >190 cells analyzed per strain. The error bars represent SD. (E) Viability assay of chromosomally integrated Opi1-mGFP variants in WT and scs2 deletion strain backgrounds. Plates were scanned after 2 d growth on solid media at the indicated temperatures.
Figure 5.
Figure 5.
MD simulations of PA and PS binding to Opi1 AH. (A) Representative structure of the AH of Opi1120–132 in a lipid bilayer from an all-atom MD simulation. The helix is represented as a gray ribbon with lysine (blue), arginine (cyan), and aspartate and glutamate (red) sidechains as sticks. Lipids are shown as tubes (carbon, blue; oxygen, red). Only the top membrane leaflet is shown. (B) Representative structure of Opi1 AH (Opi1120–132) from three perspectives: from top (left), from the N to C terminus (top right), and from the C to N terminus (bottom right). The three-finger grip forming KRK and 3K motifs are indicated. (C–F) Time-averaged positions of the phosphate moieties from two lipid species (C and E, DOPA; D and F, DOPS) in three different all-atom MD simulations (C, 20% PA; D, 20% PS; E and F, mixed 20% PA/20% PS) performed for 10 µs each. Colors indicate the localization probability of a lipid over the course of the trajectory. DOPA lipids localize closer to the 3K motif (C) than DOPS lipids (D). DOPA displaces DOPS in a mixed bilayer at both motifs (E and F). The Opi1 AH was superimposed to highlight the hotspots of lipid binding. (G–J) Distribution of pairwise distances and residence times calculated from a lipid-binding motif and the lipids present in a mixed bilayer. DOPA (red) is found closer to the AH than DOPS (orange), and POPC (gray) was found for both the KRK motif (G) and the 3K motif (I). The residence time of PA at the 3K motif was significantly longer than that of PS (J). The number of observed binding events (H and J) is indicated as a label on the x axis, and error bars represent SD. (K and L) Representative structures of a DOPA (K) or DOPS (L) lipid interacting with lysines at the 3K motif shown from the C terminus (left) and top view (right). DOPA interacts with oxygens of the phosphate moiety. DOPS interacts also with the carbonyl oxygens of serine, keeping it at a larger distance from the AH.
Figure 6.
Figure 6.
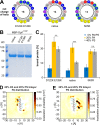
The hydrophilic face of Opi1´s AH is crucial for lipid headgroup selectivity. (A) Helical wheel representation of MBP-Opi1R180* variants using HeliQuest. (B) The indicated MBP-Opi1R180* variants were purified by a two-step purification. 1 µg of each protein was subjected to SDS-PAGE for quality control. (C) Liposome-binding assays with the indicated MBP-Opi1R180* variants were performed as in Fig. 2 C. The bar diagrams show the average of five independent experiments for the D112K E126K mutant and three independent experiments for the 5K5R mutant. Values for the native MBP-Opi1R180* variant with 0% PA, 20% PA, and 40% PS are the average of 9, 11, and 9 independent experiments, respectively, and are the same as in Fig. 2 D and Fig. 3 (C, F, and J). Error bars represent SD. Asterisks indicate significant differences: **, P < 0.05; ***, P < 0.01. (D and E) Time-averaged positions of phosphate head groups from different lipid species (DOPA, DOPS, DOPC, and POPC) relative to 5K5R AH in MD simulations performed for 2.4 µs and represented as in Fig. 5 (C–F).

References

    1. Abraham M.J., Murtola T., Schulz R., Páll S., Smith J.C., Hess B., and Lindah E.. 2015. Gromacs: High performance molecular simulations through multi-level parallelism from laptops to supercomputers. SoftwareX. 1–2:19–25. 10.1016/j.softx.2015.06.001 - DOI
    1. Antonny B. 2011. Mechanisms of membrane curvature sensing. Annu. Rev. Biochem. 80:101–123. 10.1146/annurev-biochem-052809-155121 - DOI - PubMed
    1. Antonny B., Vanni S., Shindou H., and Ferreira T.. 2015. From zero to six double bonds: phospholipid unsaturation and organelle function. Trends Cell Biol. 25:427–436. 10.1016/j.tcb.2015.03.004 - DOI - PubMed
    1. Athenstaedt K., and Daum G.. 1999. Phosphatidic acid, a key intermediate in lipid metabolism. Eur. J. Biochem. 266:1–16. 10.1046/j.1432-1327.1999.00822.x - DOI - PubMed
    1. Ballweg S., and Ernst R.. 2017. Control of membrane fluidity: the OLE pathway in focus. Biol. Chem. 398:215–228. 10.1515/hsz-2016-0277 - DOI - PubMed

Publication types

MeSH terms