. 2018 Aug 15;38(17):e00252-18.
doi: 10.1128/MCB.00252-18. Print 2018 Sep 1.

O-GlcNAcylation Signal Mediates Proteasome Inhibitor Resistance in Cancer Cells by Stabilizing NRF1

Affiliations

O-GlcNAcylation Signal Mediates Proteasome Inhibitor Resistance in Cancer Cells by Stabilizing NRF1

Hiroki Sekine et al. Mol Cell Biol. .

Abstract

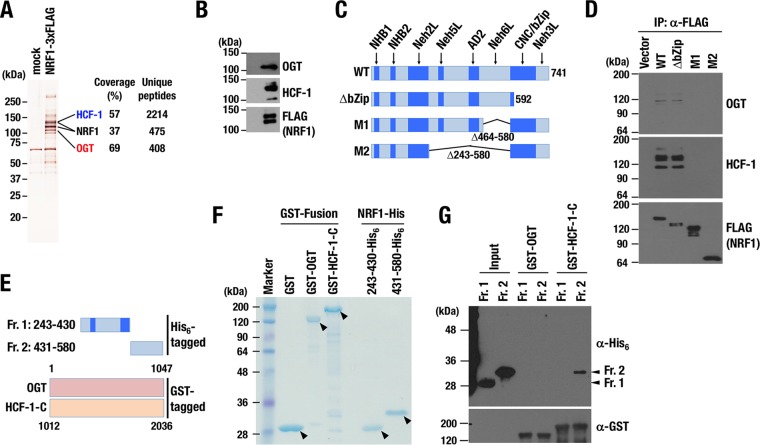
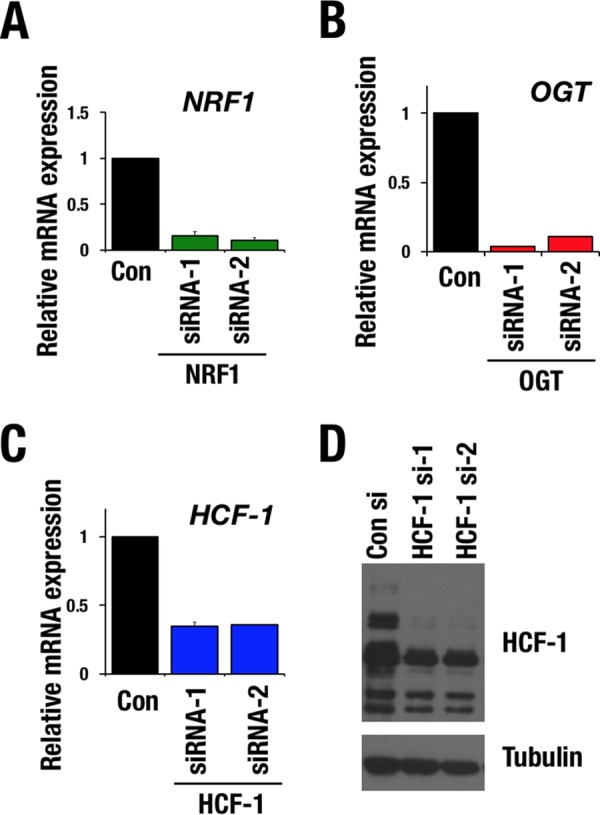
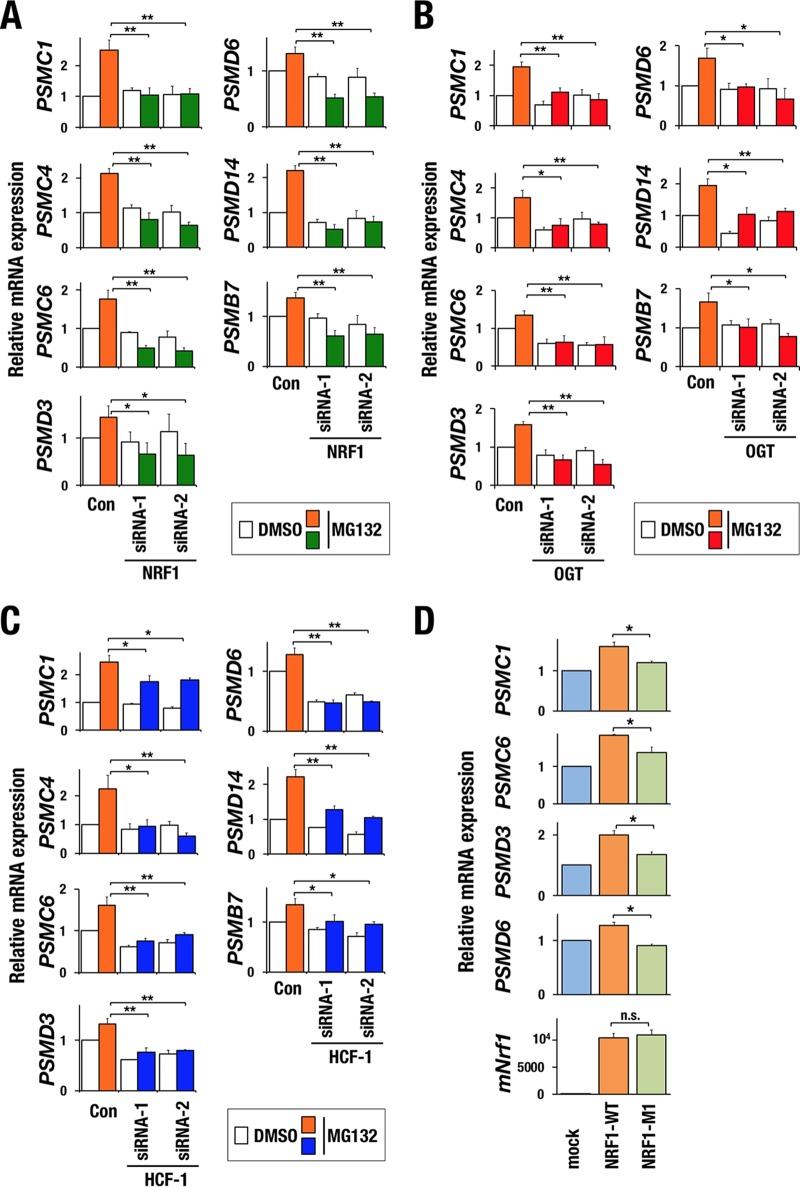
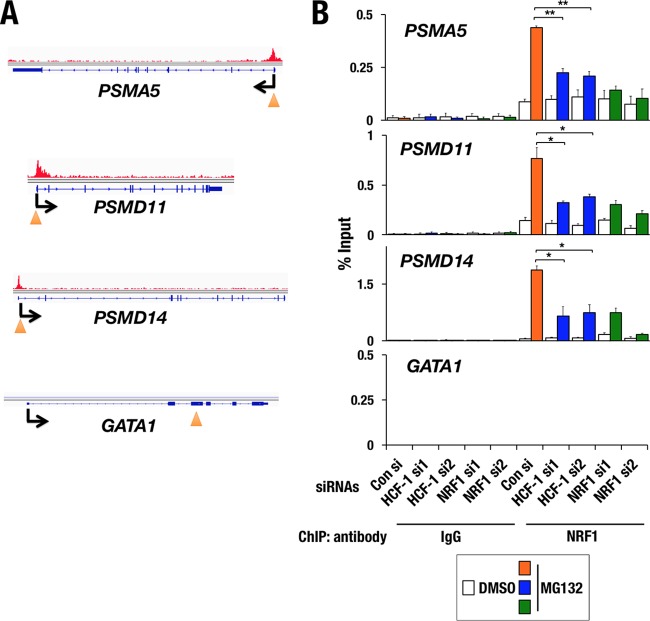
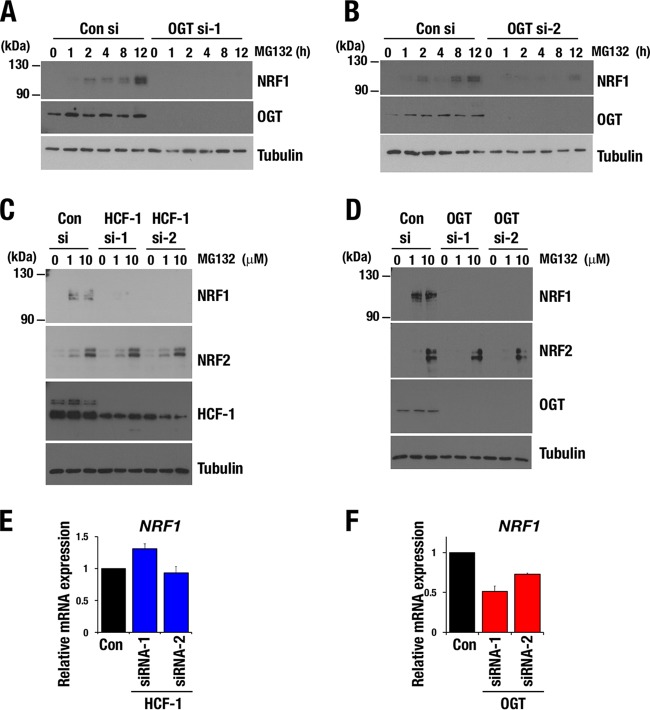
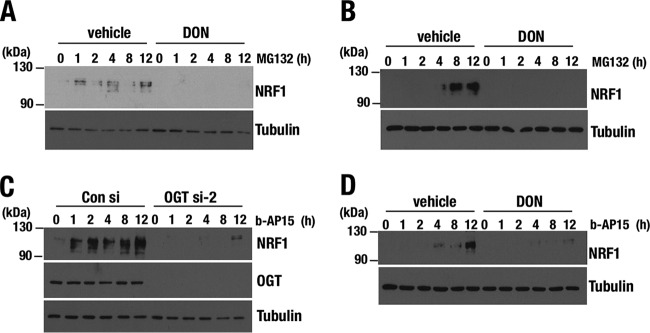
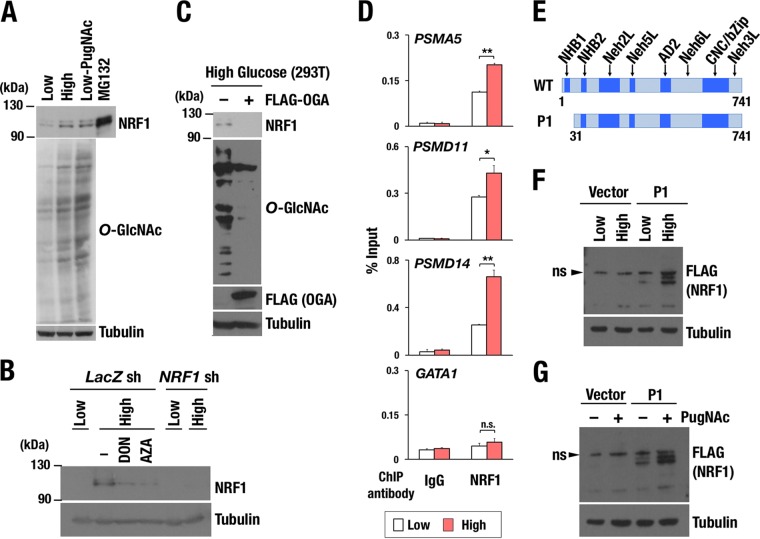
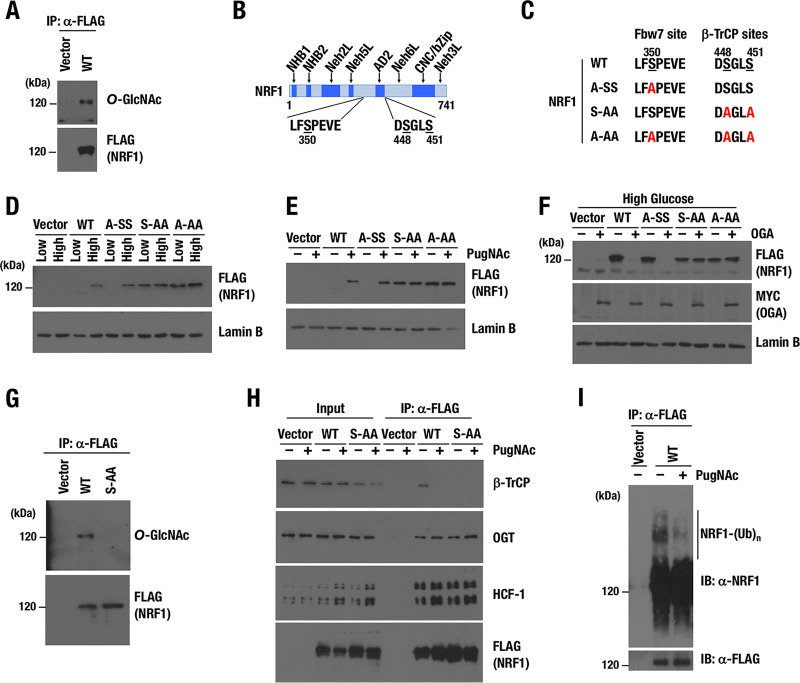
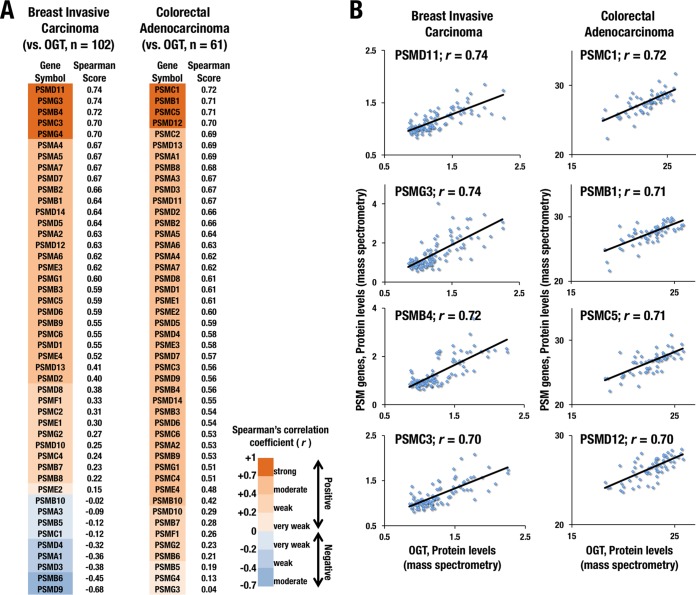
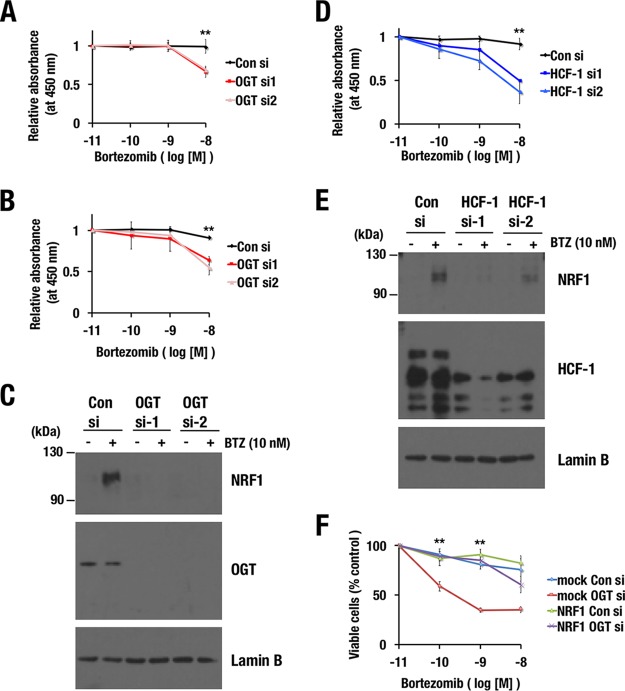
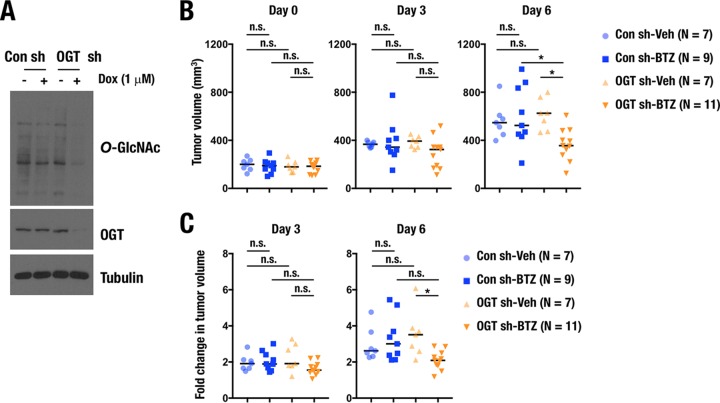
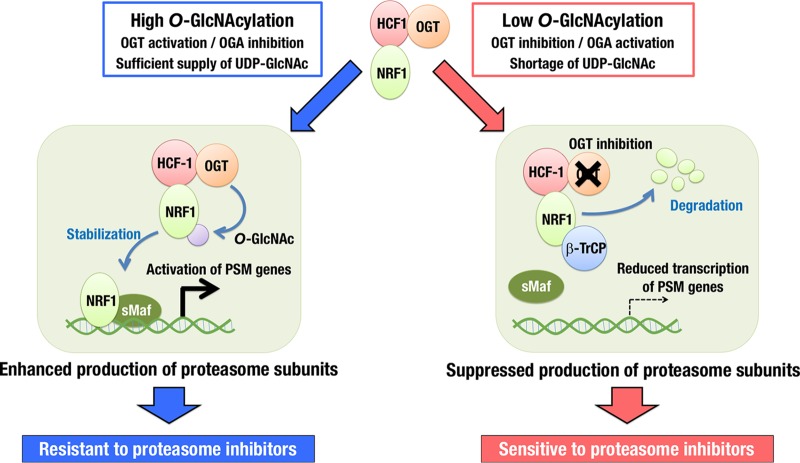
Cancer cells often heavily depend on the ubiquitin-proteasome system (UPS) for their growth and survival. Irrespective of their strong dependence on the proteasome activity, cancer cells, except for multiple myeloma, are mostly resistant to proteasome inhibitors. A major cause of this resistance is the proteasome bounce-back response mediated by NRF1, a transcription factor that coordinately activates proteasome subunit genes. To identify new targets for efficient suppression of UPS, we explored, using immunoprecipitation and mass spectrometry, the possible existence of nuclear proteins that cooperate with NRF1 and identified O-linked N-acetylglucosamine transferase (OGT) and host cell factor C1 (HCF-1) as two proteins capable of forming a complex with NRF1. O-GlcNAcylation catalyzed by OGT was essential for NRF1 stabilization and consequent upregulation of proteasome subunit genes. Meta-analysis of breast and colorectal cancers revealed positive correlations in the relative protein abundance of OGT and proteasome subunits. OGT inhibition was effective at sensitizing cancer cells to a proteasome inhibitor both in culture cells and a xenograft mouse model. Since active O-GlcNAcylation is a feature of cancer metabolism, our study has clarified a novel linkage between cancer metabolism and UPS function and added a new regulatory axis to the regulation of the proteasome activity.

Keywords: NRF1; O-GlcNAcylation; OGT; proteasome.


Figures

FIG 1
FIG 1
NRF1 interacts with the OGT/HCF-1 complex. (A) Silver staining of NRF1 nuclear complex. Nuclear extracts of 293F cells expressing NRF1-3×FLAG and those with an empty vector (mock) were pulled down with an anti-FLAG antibody. (B) Detection of OGT and HCF-1 proteins in NRF1 nuclear complex shown in panel A by immunoblot analysis. (C) Constructs of 3×FLAG fusion proteins of NRF1 deletion mutants. 3×FLAG-NRF1 WT (1–741), 3×FLAG-NRF1 ΔbZip (1–592), 3×FLAG-NRF1 M1 (Δ464–580), and 3×FLAG-NRF1 M2 (Δ243-580) were expressed in 293F cells and immunoprecipitated. (D) Detection of OGT and HCF-1 proteins interacting with NRF1 and its mutant molecules. Nuclear extracts of 293F cells expressing NRF1 and its mutant molecules were pulled down with an anti-FLAG antibody. Immunoprecipitated samples were subjected to immunoblot analysis with antibodies against OGT, HCF-1, and the FLAG tag. (E) Constructs of His6-tagged proteins of NRF1 mutants and GST fusion proteins of OGT and the C-terminal half of HCF-1 (HCF-1-C). Also shown are NRF1-Neh5L/AD2-His6 (Fr. 1; 243–430) and NRF1-Neh6L-His6 (Fr. 2; 431–580). (F) Coomassie brilliant blue staining of GST fusion proteins and His6-tag proteins. GST-OGT, GST–HCF-1-C, NRF1-Neh5L/AD2-His6 (Fr. 1; 243–430), and NRF1-Neh6L-His6 (Fr. 2; 431–580) were bacterially expressed and purified. Arrowheads indicate purified recombinant fusion proteins. (G) GST pulldown assay of NRF1-His6 fragments using GST-OGT and GST–HCF-1-C. NRF1 fragments were detected using an anti-His6 antibody, and OGT and HCF-1 were detected using an anti-GST antibody.
FIG 2
FIG 2
Knockdown efficiency of NRF1, OGT, and HCF-1 in HeLa cells. (A to C) Relative mRNA levels of NRF1 (A), OGT (B), and HCF-1 (C) in HeLa cells that were transfected with control (Con), NRF1, OGT, or HCF-1 siRNA. Values were normalized to HPRT values. Normalized values of control cells were set to 1. Averages and SD were calculated from triplicate samples. (D) Immunoblot analysis of HCF-1 in HeLa cells that were transfected with control siRNA or HCF-1 siRNAs. Tubulin was used as a loading control.
FIG 3
FIG 3
OGT/HCF-1 complex is required for activation of proteasome subunit genes in response to proteasome inhibition. (A to C) Relative mRNA levels of proteasome subunit genes. HeLa cells were transfected with control siRNA, NRF1 siRNAs (A), OGT siRNAs (B), or HCF-1 siRNAs (C). After 72 h, the cells were treated with DMSO or 1 μM MG132 for 10 h. Values were normalized to HPRT values. Normalized values of control cells that were treated with DMSO were set to 1. Averages and SD were calculated from triplicate samples. *, P < 0.05; **, P < 0.01. (D) Relative mRNA levels of proteasome subunit genes. 293F cells were stably transduced with empty vector, 3×FLAG-NRF1-WT, or 3×FLAG-NRF1-M1 expression vector and treated with high-glucose medium for 24 h before harvest. Values were normalized to HPRT values. The normalized values of mock-transduced cells were set to 1. Averages and SD were calculated from triplicate samples. *, P < 0.01. n.s., not significant.
FIG 4
FIG 4
OGT/HCF-1 complex is required for chromatin binding of NRF1. (A) NRF1 ChIP-seq binding sites in PSMA5, PSMD11, PSMD14, and GATA-1 gene loci. An arrowhead indicates the position of a primer set that was used for the ChIP assay within each target gene locus. (B) Quantitative ChIP assay at each gene locus in HeLa cells that were treated with control siRNA, two distinct siRNAs specific for HCF-1 (HCF-1-si1 and HCF-1-si2), or two distinct siRNAs specific for NRF1 (NRF1-si1 and NRF1-si2). Chromatin localization of NRF1 was examined in each sample that was treated with 1 μM MG132 or DMSO for 4 h. The values show the enrichment of immunoprecipitated DNA relative to input DNA. Averages and SDs were calculated from triplicate samples. *, P < 0.01; **, P < 0.001.
FIG 5
FIG 5
OGT/HCF-1 complex is required for accumulation of NRF1 protein. (A and B) NRF1 accumulation in response to MG132 treatment in HeLa cells. HeLa cells that were transfected with control siRNA, OGT siRNA-1 (A), or OGT siRNA-2 (B) were treated with 1 μM MG132 at 72 h after transfection. Whole-cell extracts were prepared at the indicated time points after treatment with MG132. Reduction of OGT protein was verified in OGT siRNA-treated cells, and tubulin was used as a loading control. (C and D) NRF1 and NRF2 accumulation in response to a proteasome inhibitor. MDA-MB-231 cells that were transfected with control siRNA, HCF-1 siRNAs (C), or OGT siRNAs (D) were treated with 1 or 10 μM MG132 at 72 h after the transfection and cultured for another 4 h before harvest. Whole-cell extracts were prepared and subjected to immunoblot analysis with antibodies against NRF1, NRF2, HCF-1 (C), OGT (D), and tubulin. (E and F) Relative mRNA levels of NRF1 in MDA-MB-231 cells that were transfected with control siRNA, HCF-1 siRNAs (E), or OGT siRNAs (F). Values were normalized to HPRT values. Normalized values of control cells were set to 1. Averages and SD were calculated from the results of triplicate samples.
FIG 6
FIG 6
Hexosamine biosynthesis pathway is required for accumulation of NRF1 protein. (A and B) NRF1 accumulation in response to MG132 treatment in HeLa (A) and MDA-MB231 (B) cells. HeLa and MDA-MB231 cells were pretreated with 100 μM DON for 24 h and treated with 1 μM MG132. Whole-cell extracts were prepared at the indicated time points after the cells were treated with MG132. Tubulin was used as a loading control. (C and D) NRF1 accumulation in response to b-AP15 treatment in MDA-MB231 cells. At 72 h after transfection with OGT siRNA (C) or 24 h after 100 μM DON treatment (D), whole-cell extracts were prepared at the indicated time points after treatment with b-AP15. Tubulin was used as a loading control.
FIG 7
FIG 7
Increased activity of cellular O-GlcNAcylation enhances accumulation of NRF1 protein. (A) Effect of O-GlcNAcylation on the protein level of endogenous NRF1. Whole-cell extracts were prepared from Hep3B cells that were cultured in medium containing 1.5 g/ml glucose (low), 4.5 g/ml glucose (high), or 1.5 g/ml glucose with 100 μM PugNAc (Low-PugNAc) for 24 h and subjected to immunoblot analysis with antibodies against NRF1, O-GlcNAc peptides, and tubulin. Hep3B cells that were treated with 10 μM MG132 were used as a positive control in NRF1 detection. (B) Effect of HBP inhibitors on the protein levels of endogenous NRF1. Whole-cell extracts were prepared from 293T cells expressing lacZ shRNA or NRF1 shRNA. Cells were cultured in low- or high-glucose medium with or without HBP inhibitors, 100 μM DON, or 100 μM AZA for 24 h before harvest. The protein extracts were subjected to immunoblot analysis with antibodies against NRF1 and tubulin. (C) Effect of OGA expression on the protein levels of endogenous NRF1. 293T cells were transfected with an empty or a FLAG-OGA expression vector. At 24 h after transfection, the cells were cultured in high-glucose medium for another 24 h and then harvested. Whole-cell extracts were prepared and subjected to immunoblot analysis with antibodies against NRF1, O-GlcNAc peptides, the FLAG tag, and tubulin. (D) Quantitative ChIP assay at the PSMA5, PSMD11, PSMD14, and GATA-1 gene loci in HeLa cells. Chromatin localization of NRF1 was examined in each sample that was treated with low or high glucose for 24 h. The values show the enrichment of immunoprecipitated DNA relative to input DNA. Averages and SD were calculated from triplicate samples. *, P < 0.05; **, P < 0.01. ns, not significant. (E) Constructs of 3×FLAG fusion proteins of NRF1 WT and P1 mutant (Δ30). (F and G) Accumulation of nuclear NRF1 (NRF1 P1) by enhancing cellular O-GlcNAcylation. 293F cells expressing 3×FLAG-NRF1 P1 were cultured in the medium containing low or high glucose (F) and treated with 100 μM PugNAc or left untreated (G). After 24 h, whole-cell extracts were prepared and subjected to immunoblot analysis with antibodies against the FLAG tag and tubulin.
FIG 8
FIG 8
Two serine residues, S448/S451, are critical for O-GlcNAcylation of NRF1. (A) Detection of O-GlcNAcylation of NRF1 protein. Nuclear extracts of 293T cells expressing NRF1-3×FLAG were prepared and then pulled down with an anti-FLAG antibody. Immunoprecipitated samples were subjected to immunoblot analysis with antibodies against O-GlcNAc peptides and the FLAG tag. (B) Motifs in NRF1, which mediate interaction with Fbw7 (left) and β-TrCP (right). Serine residues that were replaced with alanine in subsequent experiments are underlined. The numbers beneath the underlines denote positions of the serine residues in the amino acid sequence of the NRF1 protein. (C) Summary of serine-to-alanine substitutions in the two motifs of NRF1. (D and E) Nuclear accumulation of NRF1 and its mutant molecules in response to enhanced cellular O-GlcNAcylation induced by high-glucose condition (D) or PugNAc treatment (E). 293T cells expressing wild-type or mutant NRF1-3×FLAG (WT, A-SS, S-AA, and A-AA) were cultured in low- or high-glucose culture medium (D) or with or without 100 μM PugNAc (E) for 24 h. Nuclear extracts were prepared and subjected to immunoblot analysis with antibodies against the FLAG tag and lamin B. (F) Effects of OGA expression on the protein levels of NRF1 and its mutant molecules. 293T cells expressing wild-type or mutant NRF1-3×FLAG were transfected with an empty or a Myc-OGA expression vector. At 24 h after transfection, the cells were cultured in high-glucose medium for another 24 h and harvested. Nuclear extracts were prepared and subjected to immunoblot analysis with antibodies against the FLAG tag, Myc tag, and lamin B. (G) Identification of critical serine residues for O-GlcNAcylation of the NRF1 protein. Nuclear extracts of 293T cells expressing the WT or S-AA mutant of NRF1-3×FLAG were prepared and pulled down with an anti-FLAG antibody. Immunoprecipitated samples were subjected to immunoblot analysis with antibodies against O-GlcNAc peptides and the FLAG tag. (H) Effects of PugNAc on protein interactions with NRF1. 293T cells that were stably transfected with an empty vector or an expression vector of the WT or S-AA mutant of NRF1-3×FLAG were pretreated with 100 μM PugNAc or left untreated for 24 h before nuclear extracts were prepared for immunoprecipitation with an anti-FLAG antibody. Immunoprecipitated proteins were subjected to immunoblot analysis with antibodies against β-TrCP, OGT, HCF-1, and the FLAG tag. (I) Effects of PugNAc on ubiquitination of NRF1. 293F cells that were stably transfected with an empty vector or an expression vector of NRF1-3×FLAG were pretreated with or without 100 μM PugNAc for 24 h and incubated with 10 μM MG132 for another 4 h before whole-cell extracts were prepared for immunoprecipitation with an anti-FLAG antibody. Immunoprecipitated proteins were subjected to immunoblot analysis with antibodies against NRF1 and the FLAG tag.
FIG 9
FIG 9
Protein abundances of OGT and proteasome subunits are positively correlated in clinical specimens of breast and colorectal cancers. (A) Correlations of protein abundance of OGT and proteasome subunits in breast invasive carcinoma (left) and colorectal adenocarcinoma (right) are expressed in terms of Spearman's correlation coefficients, which are aligned in declining order. LC-MS/MS data from the TCGA database (http://www.cbioportal.org) were analyzed in the framework of the cBioPortal. (B) Dot plots showing correlations of between-protein abundances of OGT and representative proteasome subunits in breast invasive carcinoma (left) and colorectal adenocarcinoma (right). The strength of the correlations was evaluated with Spearman's rank correlation test.
FIG 10
FIG 10
Inhibition of the OGT/HCF-1 complex sensitizes cancer cell lines to a proteasome inhibitor. (A, B, and D) Effects of OGT (A and B) or HCF-1 (D) knockdown on the viability of MDA-MB-231 (A and D) and NCI-H460 (B) cells in the presence of bortezomib. At 24 h after the transfection of control siRNA or OGT or HCF-1 siRNAs, the cells were reseeded in 96-well plates. The next day, the cells were treated with the indicated concentrations of bortezomib for 24 h. Cell viability was monitored using Cell Counting Kit-8. Averages and SD were calculated from quadruplicate samples. Relative absorbances of samples that were treated with 10−11 M bortezomib were set to 1. **, P < 0.01. (C and E) Endogenous NRF1 accumulation in response to bortezomib treatment in MDA-MB-231 cells. MDA-MB-231 cells that were transfected with control siRNA, OGT siRNAs (C), or HCF-1 siRNAs (E) were treated with 10 nM bortezomib at 72 h after the transfection. After 4 h, nuclear extracts were prepared. Lamin B was used as a loading control. (F) Effects of NRF1 overexpression on OGT knockdown-induced sensitization to bortezomib. 293F cells expressing NRF1-3×FLAG or containing an empty vector (mock) were transfected with control siRNA or OGT siRNAs. At 24 h after the transfection, the cells were reseeded in 96-well plates. The next day, the cells were treated with the indicated concentrations of bortezomib for 48 h. Cell viability was assessed using a trypan blue exclusion test. Averages and SDs were calculated from the results of three independent experiments. Viable cell numbers for samples that were treated with 10−11 M bortezomib were set to 100%. **, P < 0.01.
FIG 11
FIG 11
OGT inhibition enhances antitumorigenic activity of a proteasome inhibitor. (A) Immunoblot analysis of O-GlcNAced proteins and OGT in H460 cells expressing doxycycline (Dox)-inducible control shRNA or OGT shRNAs. Whole-cell extracts were prepared at 24 h after treatment with 1 μg/ml doxycycline. Tubulin was used as a loading control. (B and C) Effects of bortezomib (BTZ) on the tumor growth of H460 cells expressing control or OGT shRNA in xenograft mice model. A total of 1 × 10⁶ H460 cells were subcutaneously transplanted into nude mice. Fifteen days after the transplantation, bortezomib was directly administered into each tumor twice. (B) Tumor volume was calculated on 3 and 6 days after the initial treatment of bortezomib. (C) Fold changes of tumor volumes on day 3 and day 6 were calculated against that on day 0. *, P < 0.05. n.s., not significant.
FIG 12
FIG 12
Schematic illustration of O-GlcNAcylation switching on and off the activity of NRF1 for transcription of proteasome subunit (PSM) genes. With low O-GlcNAcylation activity, NRF1 preferentially interacts with β-TrCP and becomes ubiquitinated and degraded. With high O-GlcNAcylation activity, which is often observed in cancer cells, NRF1 is O-GlcNAcylated by its binding partner OGT/HCF-1 complex. O-GlcNAcylation of NRF1 disrupts the association between β-TrCP and NRF1, resulting in the enhancement of NRF1 accumulation, elevation of the PSM gene expression, and resistance to proteasome inhibitors. OGT inhibition effectively sensitizes cancer cells to proteasome inhibitors by suppressing the NRF1-mediated expression of PSM genes.

Similar articles

Cited by

References

    1. Murata S, Yashiroda H, Tanaka K. 2009. Molecular mechanisms of proteasome assembly. Nat Rev Mol Cell Biol 10:104–115. doi:10.1038/nrm2630. - DOI - PubMed
    1. Xie Y. 2010. Structure, assembly and homeostatic regulation of the 26S proteasome. J Mol Cell Biol 2:308–317. doi:10.1093/jmcb/mjq030. - DOI - PubMed
    1. Schmidt M, Finley D. 2014. Regulation of proteasome activity in health and disease. Biochim Biophys Acta 1843:13–25. doi:10.1016/j.bbamcr.2013.08.012. - DOI - PMC - PubMed
    1. Frankland-Searby S, Bhaumik SR. 2012. The 26S proteasome complex: an attractive target for cancer therapy. Biochim Biophys Acta 1825:64–76. - PMC - PubMed
    1. Nijhawan D, Zack TI, Ren Y, Strickland MR, Lamothe R, Schumacher SE, Tsherniak A, Besche HC, Rosenbluh J, Shehata S, Cowley GS, Weir BA, Goldberg AL, Mesirov JP, Root DE, Bhatia SN, Beroukhim R, Hahn WC. 2012. Cancer vulnerabilities unveiled by genomic loss. Cell 150:842–854. doi:10.1016/j.cell.2012.07.023. - DOI - PMC - PubMed

Publication types

MeSH terms