Metabolic Contrasts Between Youth and Adults With Impaired Glucose Tolerance or Recently Diagnosed Type 2 Diabetes: I. Observations Using the Hyperglycemic Clamp
- PMID: 29941497
- PMCID: PMC6054493
- DOI: 10.2337/dc18-0244
Metabolic Contrasts Between Youth and Adults With Impaired Glucose Tolerance or Recently Diagnosed Type 2 Diabetes: I. Observations Using the Hyperglycemic Clamp
Abstract
Objective: To compare insulin sensitivity (M/I) and β-cell responses in youth versus adults with impaired glucose tolerance (IGT) or drug-naïve, recently diagnosed type 2 diabetes.
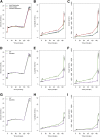
Research design and methods: In 66 youth (80.3% with IGT) and 355 adults (70.7% IGT), hyperglycemic clamps were used to measure 1) M/I, 2) acute (0-10 min [first phase]) C-peptide (ACPRg) and insulin (AIRg) responses to glucose, 3) steady-state C-peptide and insulin concentrations at plasma glucose of 11.1 mmol/L, and 4) arginine-stimulated maximum C-peptide (ACPRmax) and insulin (AIRmax) responses at plasma glucose >25 mmol/L. The fasting C-peptide-to-insulin ratio was used as an estimate of insulin clearance.
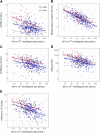
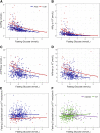
Results: Insulin sensitivity was 46% lower in youth compared with adults (P < 0.001), and youth had greater acute and steady-state C-peptide (2.3- and 1.3-fold, respectively; each P < 0.001) and insulin responses to glucose (AIRg 3.0-fold and steady state 2.2-fold; each P < 0.001). Arginine-stimulated C-peptide and insulin responses were also greater in youth (1.6- and 1.7-fold, respectively; each P < 0.001). After adjustment for insulin sensitivity, all β-cell responses remained significantly greater in youth. Insulin clearance was reduced in youth (P < 0.001). Participants with diabetes had greater insulin sensitivity (P = 0.026), with lesser C-peptide and insulin responses than those with IGT (all P < 0.001) but similar insulin clearance (P = 0.109).
Conclusions: In people with IGT or recently diagnosed diabetes, youth have lower insulin sensitivity, hyperresponsive β-cells, and reduced insulin clearance compared with adults. Whether these age-related differences contribute to declining β-cell function and/or impact responses to glucose-lowering interventions remains to be determined.
Trial registration: ClinicalTrials.gov NCT01779362 NCT01779375 NCT01763346.
© 2018 by the American Diabetes Association.
Figures


Comment in
-
Can We RISE to the Challenge of Youth-Onset Type 2 Diabetes?Diabetes Care. 2018 Aug;41(8):1560-1562. doi: 10.2337/dci18-0025. Epub 2018 Jun 25. Diabetes Care. 2018. PMID: 29941499 Free PMC article. No abstract available.
References
-
- Ogurtsova K, da Rocha Fernandes JD, Huang Y, et al. . IDF Diabetes Atlas: global estimates for the prevalence of diabetes for 2015 and 2040. Diabetes Res Clin Pract 2017;128:40–50 - PubMed
-
- Centers for Disease Control and Prevention. National Diabetes Statistics Report, 2017 [article online], 2017. Available from https://www.cdc.gov/diabetes/pdfs/data/statistics/national-diabetes-stat.... Accessed 18 July 2017
-
- World Health Organzation. Global Health Observatory (GHO) data. Overweight and obesity [Internet], 2017. Available from http://www.who.int/gho/ncd/risk_factors/overweight/en/. Accessed 24 August 2017
Publication types
MeSH terms
Substances
Associated data
Grants and funding
- UL1 TR000430/TR/NCATS NIH HHS/United States
- U01 DK094406/DK/NIDDK NIH HHS/United States
- UL1 TR001857/TR/NCATS NIH HHS/United States
- UL1 TR001863/TR/NCATS NIH HHS/United States
- U01 DK094431/DK/NIDDK NIH HHS/United States
- U01 DK094430/DK/NIDDK NIH HHS/United States
- U01 DK094438/DK/NIDDK NIH HHS/United States
- P30 DK045735/DK/NIDDK NIH HHS/United States
- UL1 TR001082/TR/NCATS NIH HHS/United States
- TL1 TR001107/TR/NCATS NIH HHS/United States
- P30 DK020595/DK/NIDDK NIH HHS/United States
- P30 DK017047/DK/NIDDK NIH HHS/United States
- TL1 TR001858/TR/NCATS NIH HHS/United States
- UL1 TR001108/TR/NCATS NIH HHS/United States
- U01 DK094467/DK/NIDDK NIH HHS/United States
- P30 DK097512/DK/NIDDK NIH HHS/United States
- K24 HL145076/HL/NHLBI NIH HHS/United States
- UL1 TR001855/TR/NCATS NIH HHS/United States
LinkOut - more resources
Full Text Sources
Other Literature Sources
Medical

