

Metabolic Contrasts Between Youth and Adults With Impaired Glucose Tolerance or Recently Diagnosed Type 2 Diabetes: II. Observations Using the Oral Glucose Tolerance Test
- PMID: 29941498
- PMCID: PMC6054494
- DOI: 10.2337/dc18-0243
Metabolic Contrasts Between Youth and Adults With Impaired Glucose Tolerance or Recently Diagnosed Type 2 Diabetes: II. Observations Using the Oral Glucose Tolerance Test
Abstract
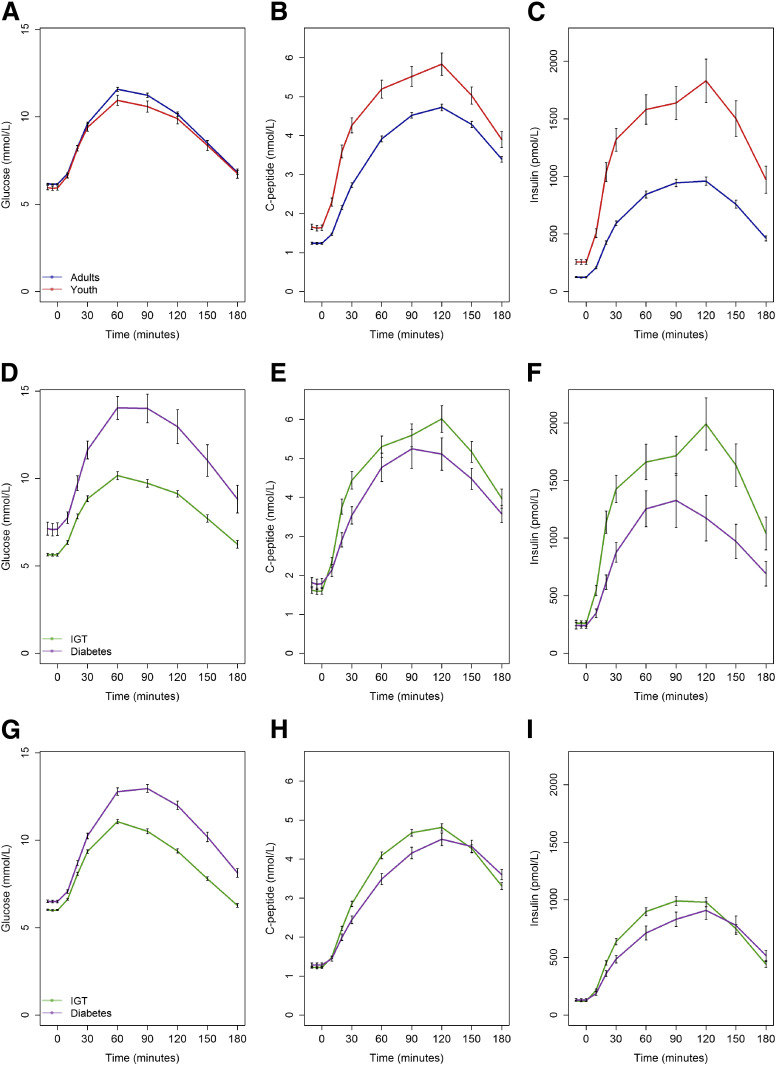
Objective: To compare oral glucose tolerance test (OGTT) glucose, C-peptide, and insulin responses and insulin sensitivity in youth and adults with impaired glucose tolerance (IGT) or recently diagnosed type 2 diabetes.
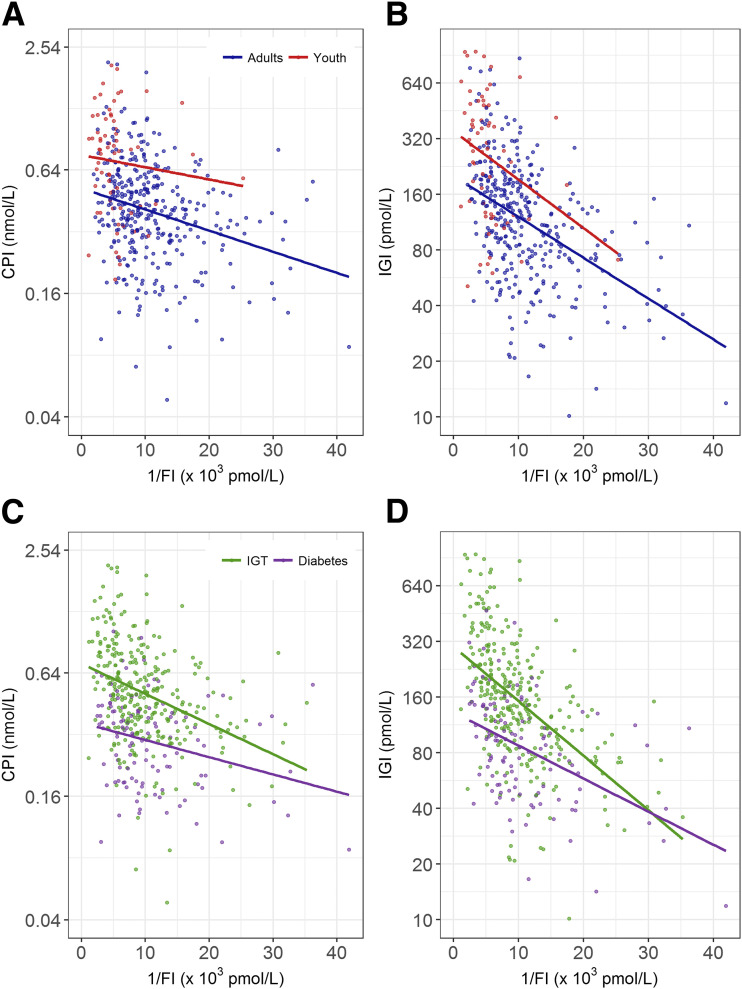
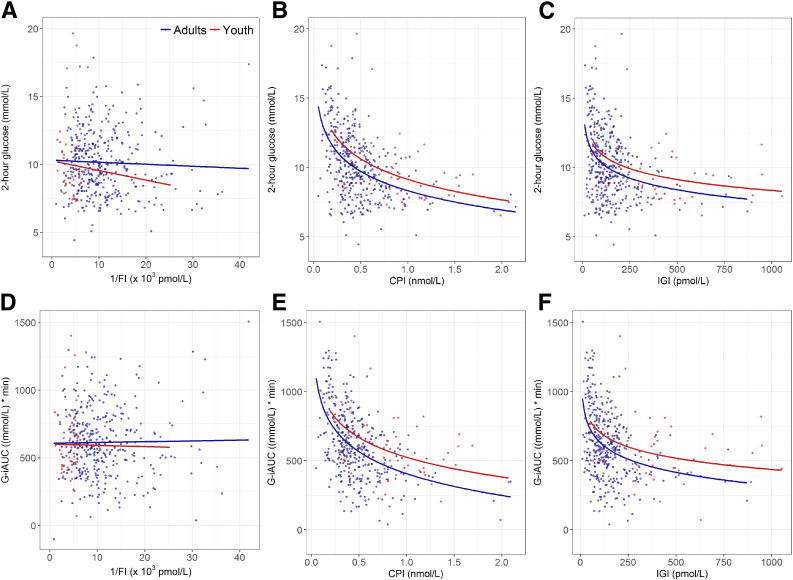
Research design and methods: A total of 66 youth (80.3% with IGT) and 355 adults (70.7% with IGT) underwent a 3-h OGTT to assess 1) insulin sensitivity (1/fasting insulin), 2) C-peptide index (CPI) and insulinogenic index (IGI) over the first 30 min, and 3) glucose, C-peptide, and insulin incremental areas above fasting over the 3-h post-ingestion (incremental glucose [G-iAUC], incremental C-peptide [CP-iAUC], and incremental insulin area under the curve [I-iAUC] responses, respectively).
Results: Fasting, 2-h glucose, and G-iAUC were similar in both age-groups, but youth had ∼50% lower 1/fasting insulin (P < 0.001), 75% higher CPI (mean [95% CI] 0.703 [0.226, 2.183] vs. 0.401 [0.136, 1.183] nmol/mmol; P < 0.001), and more than twofold higher IGI (257.3 [54.5, 1,215.8] vs. 114.8 [28.0, 470.8] pmol/mmol; P < 0.001). Two-hour C-peptide and insulin concentrations, CP-iAUC, and I-iAUC were all higher in youth (all P < 0.001). C-peptide and insulin responses remained significantly greater in youth after adjustment for insulin sensitivity. Within each age-group, individuals with type 2 diabetes versus IGT had significantly lower CPI and IGI with no difference in insulin sensitivity.
Conclusions: The balance between insulin sensitivity and β-cell responses differs between youth and adults with IGT or recently diagnosed type 2 diabetes. Despite similar postload glucose levels, youth demonstrate greater C-peptide and insulin responses that exceed what is needed to compensate for their lower insulin sensitivity. Longitudinal studies are required to determine whether this feature contributes to a more rapid decline in β-cell function in youth with dysglycemia.
Trial registration: ClinicalTrials.gov NCT01779362 NCT01779375 NCT01763346.
© 2018 by the American Diabetes Association.
Figures
Comment in
-
Can We RISE to the Challenge of Youth-Onset Type 2 Diabetes?Diabetes Care. 2018 Aug;41(8):1560-1562. doi: 10.2337/dci18-0025. Epub 2018 Jun 25. Diabetes Care. 2018. PMID: 29941499 Free PMC article. No abstract available.
References
-
- Hannon TS, Arslanian SA. The changing face of diabetes in youth: lessons learned from studies of type 2 diabetes. Ann N Y Acad Sci 2015;1353:113–137 - PubMed
Publication types
MeSH terms
Substances
Associated data
Grants and funding
- UL1 TR000430/TR/NCATS NIH HHS/United States
- U01 DK094406/DK/NIDDK NIH HHS/United States
- UL1 TR001857/TR/NCATS NIH HHS/United States
- UL1 TR001863/TR/NCATS NIH HHS/United States
- U01 DK094431/DK/NIDDK NIH HHS/United States
- U01 DK094430/DK/NIDDK NIH HHS/United States
- U01 DK094438/DK/NIDDK NIH HHS/United States
- P30 DK045735/DK/NIDDK NIH HHS/United States
- UL1 TR001082/TR/NCATS NIH HHS/United States
- TL1 TR001107/TR/NCATS NIH HHS/United States
- P30 DK020595/DK/NIDDK NIH HHS/United States
- P30 DK017047/DK/NIDDK NIH HHS/United States
- TL1 TR001858/TR/NCATS NIH HHS/United States
- UL1 TR001108/TR/NCATS NIH HHS/United States
- U01 DK094467/DK/NIDDK NIH HHS/United States
- P30 DK097512/DK/NIDDK NIH HHS/United States
- K24 HL145076/HL/NHLBI NIH HHS/United States
- UL1 TR001855/TR/NCATS NIH HHS/United States
LinkOut - more resources
Full Text Sources
Other Literature Sources
Medical
Miscellaneous
