

Impact of Insulin and Metformin Versus Metformin Alone on β-Cell Function in Youth With Impaired Glucose Tolerance or Recently Diagnosed Type 2 Diabetes
- PMID: 29941500
- PMCID: PMC6054504
- DOI: 10.2337/dc18-0787
Impact of Insulin and Metformin Versus Metformin Alone on β-Cell Function in Youth With Impaired Glucose Tolerance or Recently Diagnosed Type 2 Diabetes
Abstract
Objective: Pediatric type 2 diabetes prevalence is increasing, with β-cell dysfunction key in its pathogenesis. The RISE Pediatric Medication Study compared two approaches-glargine followed by metformin and metformin alone-in preserving or improving β-cell function in youth with impaired glucose tolerance (IGT) or recently diagnosed type 2 diabetes during and after therapy withdrawal.
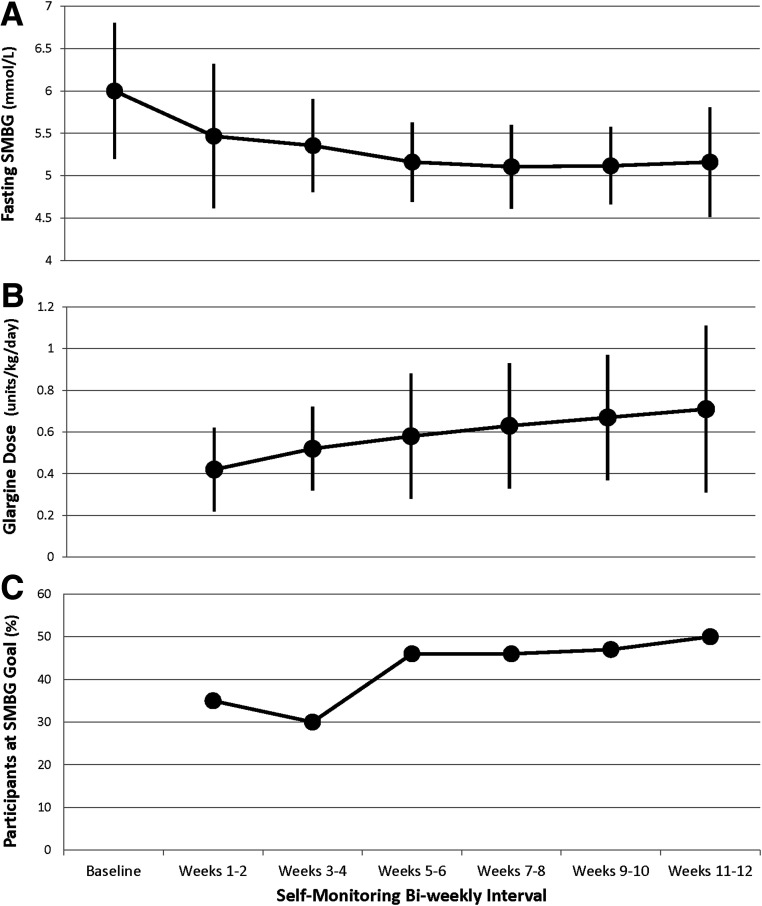
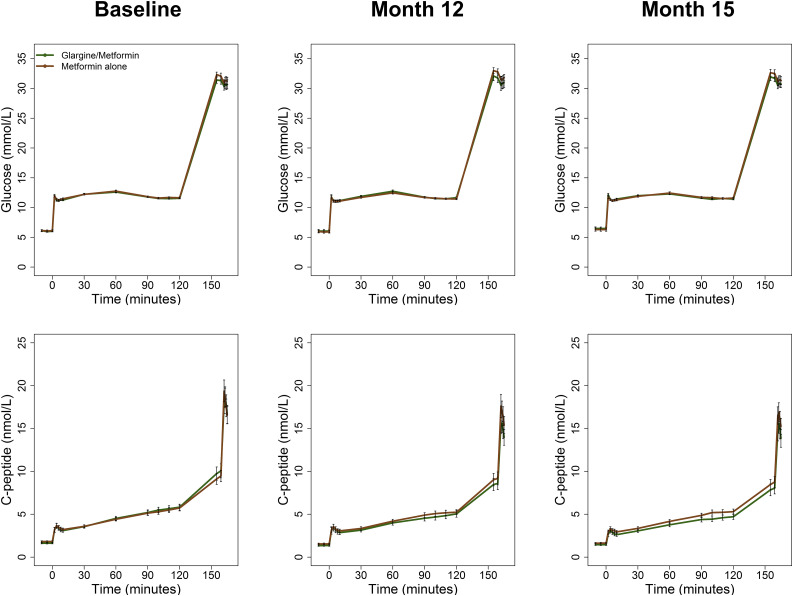
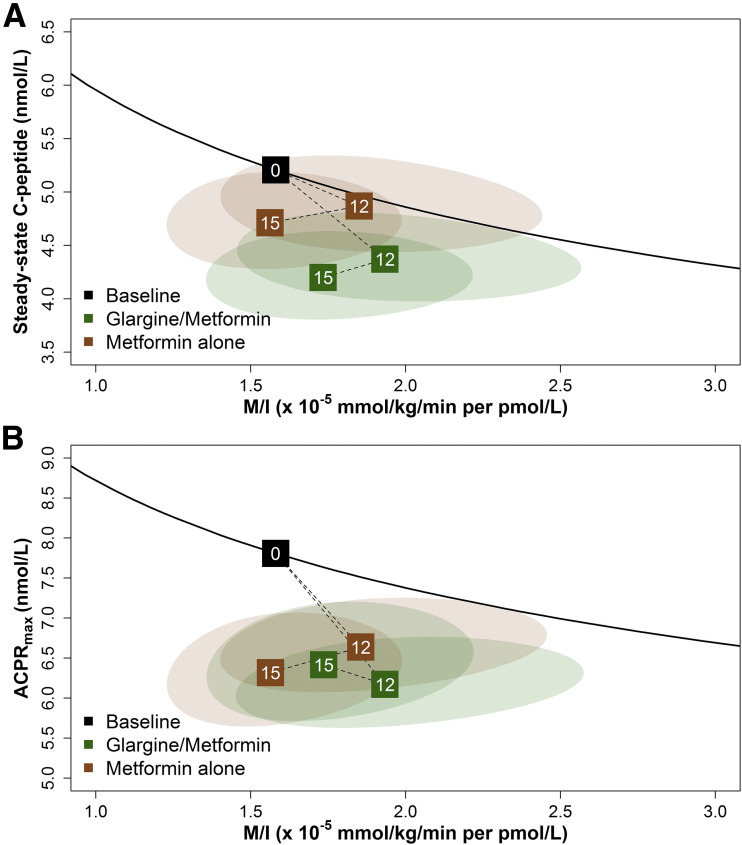
Research design and methods: Ninety-one pubertal, overweight/obese 10-19-year-old youth with IGT (60%) or type 2 diabetes of <6 months duration (40%) were randomized to either 3 months of insulin glargine with a target glucose of 4.4-5.0 mmol/L followed by 9 months of metformin or to 12 months of metformin alone. β-Cell function (insulin sensitivity paired with β-cell responses) was assessed by hyperglycemic clamp at baseline, 12 months (on treatment), and 15 months (3 months off treatment).
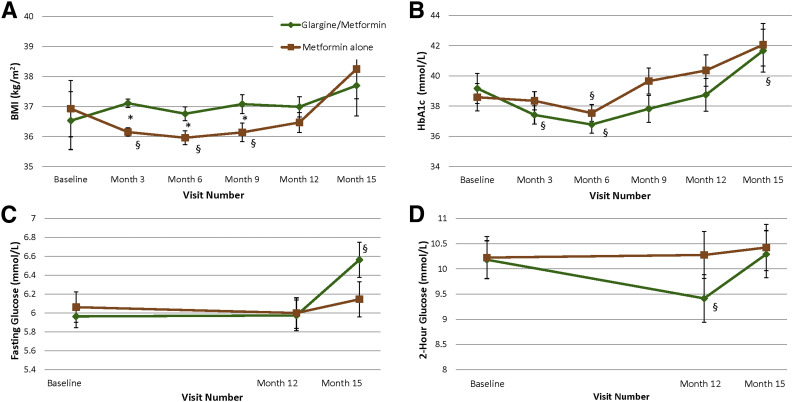
Results: No significant differences were observed between treatment groups at baseline, 12 months, or 15 months in β-cell function, BMI percentile, HbA1c, fasting glucose, or oral glucose tolerance test 2-h glucose results. In both treatment groups, clamp-measured β-cell function was significantly lower at 12 and 15 months versus baseline. HbA1c fell transiently at 6 months within both groups. BMI was higher in the glargine followed by metformin versus metformin alone group between 3 and 9 months. Only 5% of participants discontinued the interventions, and both treatments were well tolerated.
Conclusions: In youth with IGT or recently diagnosed type 2 diabetes, neither 3 months of glargine followed by 9 months of metformin nor 12 months of metformin alone halted the progressive deterioration of β-cell function. Alternate approaches to preserve β-cell function in youth are needed.
Trial registration: ClinicalTrials.gov NCT01779375.
© 2018 by the American Diabetes Association.
Figures
Comment in
-
Can We RISE to the Challenge of Youth-Onset Type 2 Diabetes?Diabetes Care. 2018 Aug;41(8):1560-1562. doi: 10.2337/dci18-0025. Epub 2018 Jun 25. Diabetes Care. 2018. PMID: 29941499 Free PMC article. No abstract available.
Similar articles
-
Withdrawal of medications leads to worsening of OGTT parameters in youth with impaired glucose tolerance or recently-diagnosed type 2 diabetes.Pediatr Diabetes. 2020 Dec;21(8):1437-1446. doi: 10.1111/pedi.13129. Epub 2020 Oct 13. Pediatr Diabetes. 2020. PMID: 32985775 Free PMC article. Clinical Trial.
-
Lack of Durable Improvements in β-Cell Function Following Withdrawal of Pharmacological Interventions in Adults With Impaired Glucose Tolerance or Recently Diagnosed Type 2 Diabetes.Diabetes Care. 2019 Sep;42(9):1742-1751. doi: 10.2337/dc19-0556. Epub 2019 Jun 9. Diabetes Care. 2019. PMID: 31178434 Free PMC article.
-
Effects of Treatment of Impaired Glucose Tolerance or Recently Diagnosed Type 2 Diabetes With Metformin Alone or in Combination With Insulin Glargine on β-Cell Function: Comparison of Responses In Youth And Adults.Diabetes. 2019 Aug;68(8):1670-1680. doi: 10.2337/db19-0299. Epub 2019 Jun 9. Diabetes. 2019. PMID: 31178433 Free PMC article.
-
Impaired beta-cell and alpha-cell function in African-American children with type 2 diabetes mellitus--"Flatbush diabetes".J Pediatr Endocrinol Metab. 2002 Apr;15 Suppl 1:493-501. J Pediatr Endocrinol Metab. 2002. PMID: 12017222 Review.
-
Pathophysiology of type 2 diabetes mellitus in youth: the evolving chameleon.Arq Bras Endocrinol Metabol. 2009 Mar;53(2):165-74. doi: 10.1590/s0004-27302009000200008. Arq Bras Endocrinol Metabol. 2009. PMID: 19466209 Free PMC article. Review.
Cited by
-
Greater and More Focused Measures Are Needed to Tackle Diabetes and Obesity Epidemics in the Nations of the Gulf Cooperation Council.Int J Endocrinol. 2021 Mar 26;2021:6661346. doi: 10.1155/2021/6661346. eCollection 2021. Int J Endocrinol. 2021. PMID: 33833799 Free PMC article. Review.
-
Beta-cell function in type 2 diabetes (T2DM): Can it be preserved or enhanced?J Diabetes. 2023 Oct;15(10):817-837. doi: 10.1111/1753-0407.13446. Epub 2023 Jul 31. J Diabetes. 2023. PMID: 37522521 Free PMC article. Review.
-
Can We RISE to the Challenge of Youth-Onset Type 2 Diabetes?Diabetes Care. 2018 Aug;41(8):1560-1562. doi: 10.2337/dci18-0025. Epub 2018 Jun 25. Diabetes Care. 2018. PMID: 29941499 Free PMC article. No abstract available.
-
Effect of Early Glycemic Control in Youth-Onset Type 2 Diabetes on Longer-Term Glycemic Control and β-Cell Function: Results From the TODAY Study.Diabetes Care. 2023 Aug 1;46(8):1507-1514. doi: 10.2337/dc23-0560. Diabetes Care. 2023. PMID: 37378967 Free PMC article.
-
Insulin resistance and cardiovascular disease.J Int Med Res. 2023 Mar;51(3):3000605231164548. doi: 10.1177/03000605231164548. J Int Med Res. 2023. PMID: 36994866 Free PMC article. Review.
References
-
- Kahn SE, Haffner SM, Heise MA, et al. .; ADOPT Study Group . Glycemic durability of rosiglitazone, metformin, or glyburide monotherapy. N Engl J Med 2006;355:2427–2443 - PubMed
Publication types
MeSH terms
Substances
Associated data
Grants and funding
- UL1 TR000430/TR/NCATS NIH HHS/United States
- U01 DK094406/DK/NIDDK NIH HHS/United States
- UL1 TR001857/TR/NCATS NIH HHS/United States
- UL1 TR001863/TR/NCATS NIH HHS/United States
- U01 DK094431/DK/NIDDK NIH HHS/United States
- U01 DK094430/DK/NIDDK NIH HHS/United States
- U01 DK094438/DK/NIDDK NIH HHS/United States
- P30 DK045735/DK/NIDDK NIH HHS/United States
- UL1 TR001082/TR/NCATS NIH HHS/United States
- P30 DK020595/DK/NIDDK NIH HHS/United States
- P30 DK017047/DK/NIDDK NIH HHS/United States
- TL1 TR001858/TR/NCATS NIH HHS/United States
- UL1 TR001108/TR/NCATS NIH HHS/United States
- U01 DK094467/DK/NIDDK NIH HHS/United States
- P30 DK097512/DK/NIDDK NIH HHS/United States
- K24 HL145076/HL/NHLBI NIH HHS/United States
- UL1 TR001855/TR/NCATS NIH HHS/United States
LinkOut - more resources
Full Text Sources
Other Literature Sources
Medical
Miscellaneous
