Soluble stroma-related biomarkers of pancreatic cancer
- PMID: 29941541
- PMCID: PMC6079536
- DOI: 10.15252/emmm.201708741
Soluble stroma-related biomarkers of pancreatic cancer
Abstract
The clinical management of pancreatic ductal adenocarcinoma (PDAC) is hampered by the lack of reliable biomarkers. This study investigated the value of soluble stroma-related molecules as PDAC biomarkers. In the first exploratory phase, 12 out of 38 molecules were associated with PDAC in a cohort of 25 PDAC patients and 16 healthy subjects. A second confirmatory phase on an independent cohort of 131 PDAC patients, 30 chronic pancreatitis patients, and 131 healthy subjects confirmed the PDAC association for MMP7, CCN2, IGFBP2, TSP2, sICAM1, TIMP1, and PLG Multivariable logistic regression model identified biomarker panels discriminating respectively PDAC versus healthy subjects (MMP7 + CA19.9, AUC = 0.99, 99% CI = 0.98-1.00) (CCN2 + CA19.9, AUC = 0.96, 99% CI = 0.92-0.99) and PDAC versus chronic pancreatitis (CCN2 + PLG+FN+Col4 + CA19.9, AUC = 0.94, 99% CI = 0.88-0.99). Five molecules were associated with PanIN development in two GEM models of PDAC (PdxCre/LSL-KrasG12D and PdxCre/LSL-KrasG12D/+/LSL-Trp53R172H/+), suggesting their potential for detecting early disease. These markers were also elevated in patient-derived orthotopic PDAC xenografts and associated with response to chemotherapy. The identified stroma-related soluble biomarkers represent potential tools for PDAC diagnosis and for monitoring treatment response of PDAC patients.
Keywords: circulating biomarkers; early diagnosis; pancreatic cancer; treatment evaluation; tumor microenvironment.
© 2018 The Authors. Published under the terms of the CC BY 4.0 license.
Figures


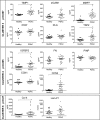
- A
Plasma levels of selected candidate biomarkers analyzed in healthy subjects (n = 131), pancreatitis patients (n = 30), and PDAC patients (n = 131). Data are expressed as a scatter plot, mean ± SEM, *P < 0.001 (Wilcoxon rank‐sum test).
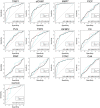
- B
Receiver operator characteristic (ROC) curves of the single biomarkers and of biomarker panels (indicated with All) for diagnosis of PDAC versus healthy controls and PDAC versus pancreatitis. Areas under the curve (AUC) with 99% CI are presented.


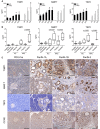
- A
Levels of TIMP1, MMP7, and TSP2 in plasma of KC mice (n = 7–9) at 60, 120, 180, 240, and 330 days of age and of KPC mice (n = 3–8) at 30, 90, and 150 days of age (mean ± SEM). *P < 0.05 (Mann–Whitney). The exact n and P‐values are indicated in Appendix Table S3A.
- B
Levels of TIMP1, MMP7, and TSP2 in plasma of healthy mice (n = 15), mice with chronic pancreatitis at 150 days of age (n = 19), KC mice at 330 days of age (control PdxCre n = 3–4; KC n = 7–8), and KPC mice at 150 days of age (control PdxCre n = 4–7; KPC n = 4). The exact n is indicated in Appendix Table S3B. Box plots extend from 25th to 75th percentiles, whiskers extend from min to max, and horizontal lines indicate median. P‐values were calculated with one‐way ANOVA with Tukey's multiple comparison test.
- C
Histological analysis of pancreas from PdxCre and KC mice with different grades of PanIN lesions at 330 days of age. Anti‐TIMP1, anti‐MMP7, anti‐TSP2, and anti‐CCN2 staining of a representative KC PanIN lesion (200×, scale bars: 100 μm).

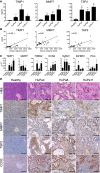
- A
Levels of murine TIMP1, MMP7, and TSP2 in plasma of mice bearing PDAC‐PDX (HuPa4, HuPa8, and HuPa11) growing orthotopically in the pancreas (mean ± SEM; n ≥ 3 for each group), *P < 0.05 (Mann–Whitney). The exact n and P‐values are indicated in Appendix Table S4A.
- B
Correlations between the levels of the three selected biomarkers and the tumor volume in mice bearing HuPa8. Pearson coefficient (r).
- C
Expression of murine TIMP1, MMP7, TSP2, CCN2, ICAM1, IGFBP2, and PLG analyzed in tumors from pancreas (HuPa4, HuPa8, and HuPa11) by RT–PCR. The expression level of target genes was normalized to the geometric median of β‐actin and GAPDH housekeeping genes and expressed as 2‐ΔΔCT (mean ± SEM, *P < 0.05; Healthy n = 7; HuPa4, HuPa8, and HuPa11 n = 4) (Mann–Whitney). The exact P‐values are indicated in Appendix Table S4B.
- D
Histological analysis of representative PDAC‐PDX (HuPa4, HuPa8, and HuPa11). Hematoxylin–eosin, anti‐TIMP1, anti‐MMP7, anti‐TSP2, and anti‐CCN2 staining of PDAC‐PDX tumors (200×, scale bars: 100 μm).

- A
Levels of TIMP1, MMP7, and TSP2 in plasma of mice bearing orthotopic HuPa8 at 30, 90, and 150 days after tumor transplantation (mean ± SEM; n ≥ 4 for each group). *P < 0.05 (Mann–Whitney). The exact n and P‐values are indicated in Appendix Table S5A.
- B
Magnetic resonance imaging of HuPa8. Representative images are shown; the white dotted lines indicate tumor masses.
- C
Tumor growth over time measured by MRI; each black arrow indicates one treatment (mean ± SEM; n = 4 for each group; two‐way ANOVA with Tukey's multiple comparison test).
- D
Levels of the three selected biomarkers in plasma of HuPa8‐bearing mice, prior to (day 80; at randomization), during (day 120), and after (day 165) treatments (mean ± SEM; n ≥ 4 for each group; two‐way ANOVA with Tukey's multiple comparison test). The exact n is indicated in Appendix Table S5B.
References
-
- Bloomston M, Zhou JX, Rosemurgy AS, Frankel W, Muro‐Cacho CA, Yeatman TJ (2006) Fibrinogen gamma overexpression in pancreatic cancer identified by large‐scale proteomic analysis of serum samples. Cancer Res 66: 2592–2599 - PubMed
Publication types
MeSH terms
Substances
LinkOut - more resources
Full Text Sources
Other Literature Sources
Medical
Research Materials
Miscellaneous

