. 2018 Jul 10;115(28):E6546-E6555.
doi: 10.1073/pnas.1720113115. Epub 2018 Jun 25.

Fatty acid metabolism complements glycolysis in the selective regulatory T cell expansion during tumor growth

Affiliations

Fatty acid metabolism complements glycolysis in the selective regulatory T cell expansion during tumor growth

Ilenia Pacella et al. Proc Natl Acad Sci U S A. .

Abstract

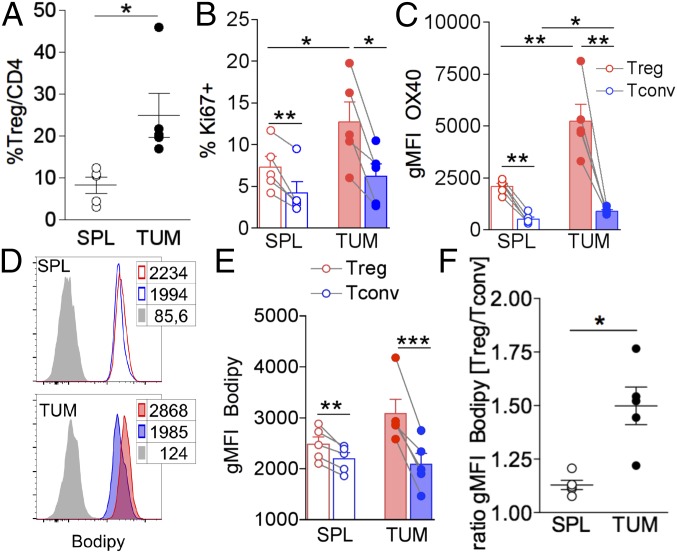
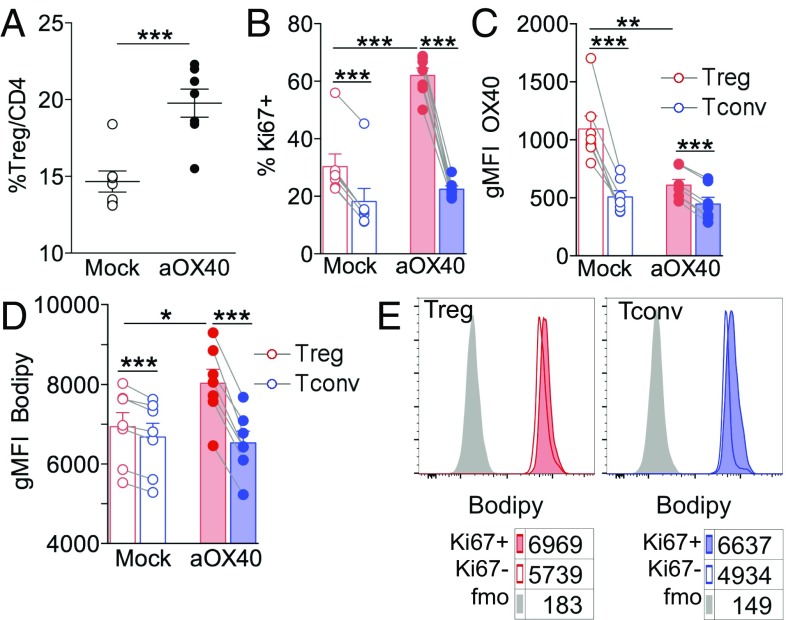
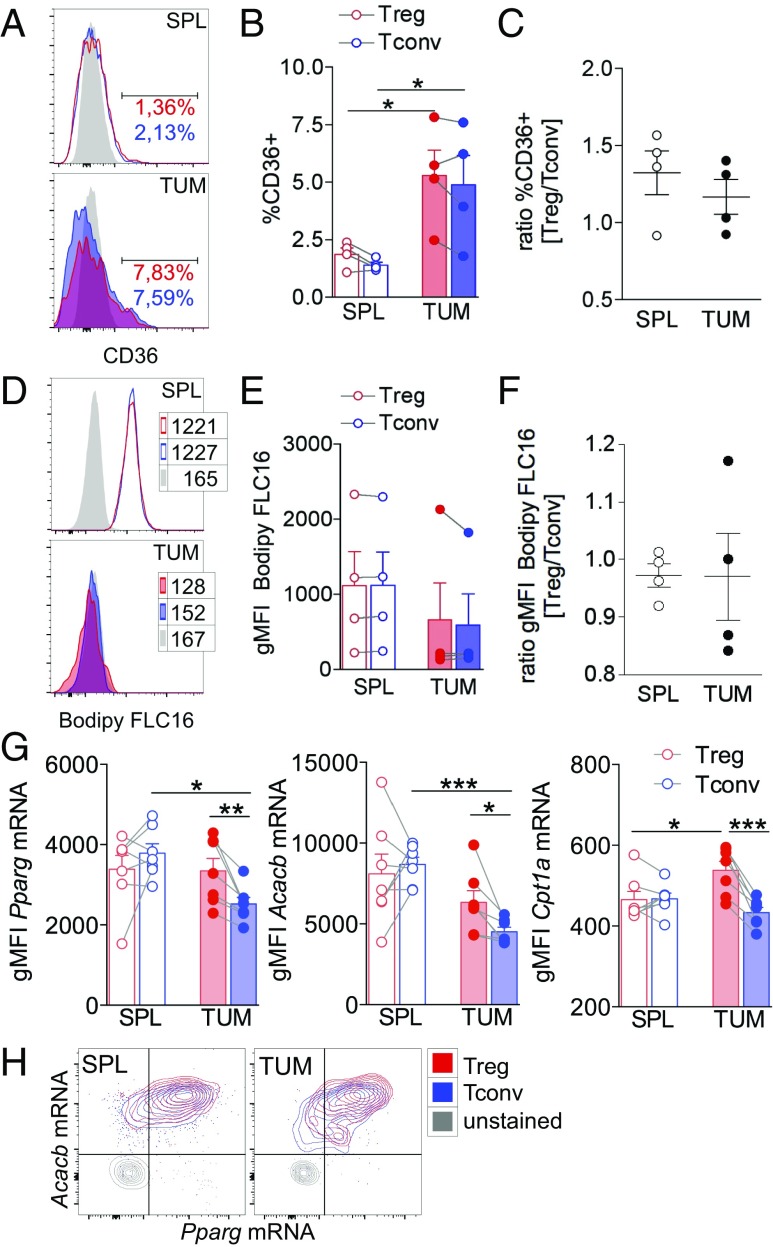
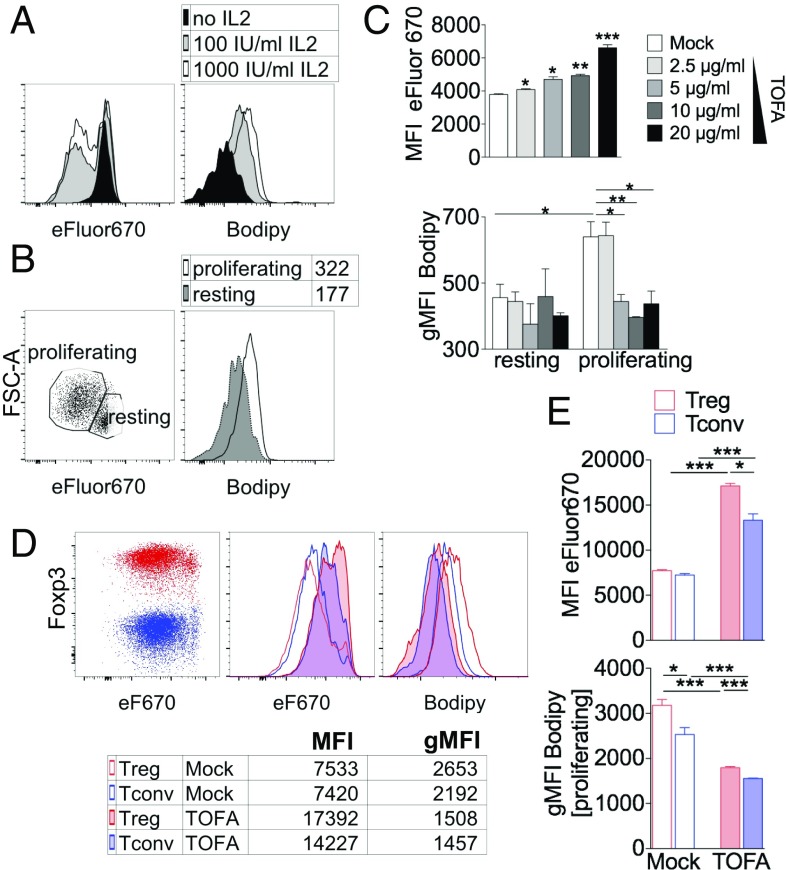
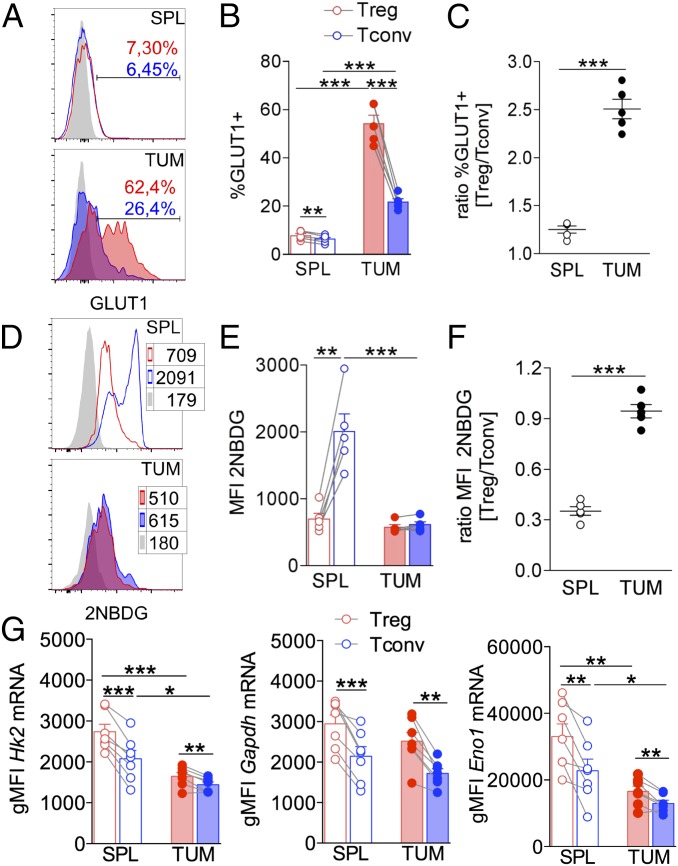
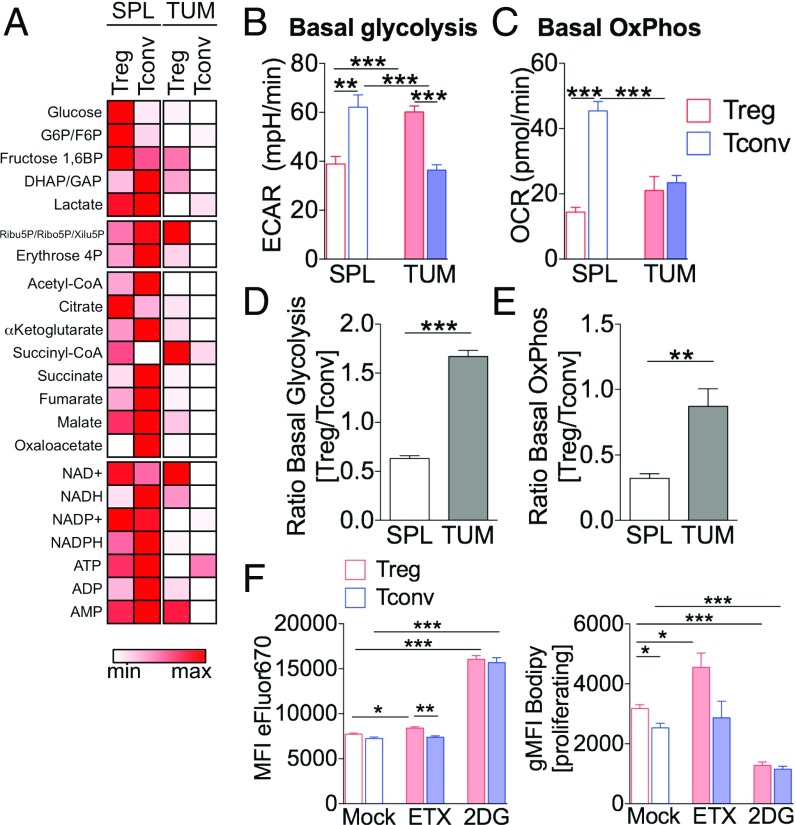
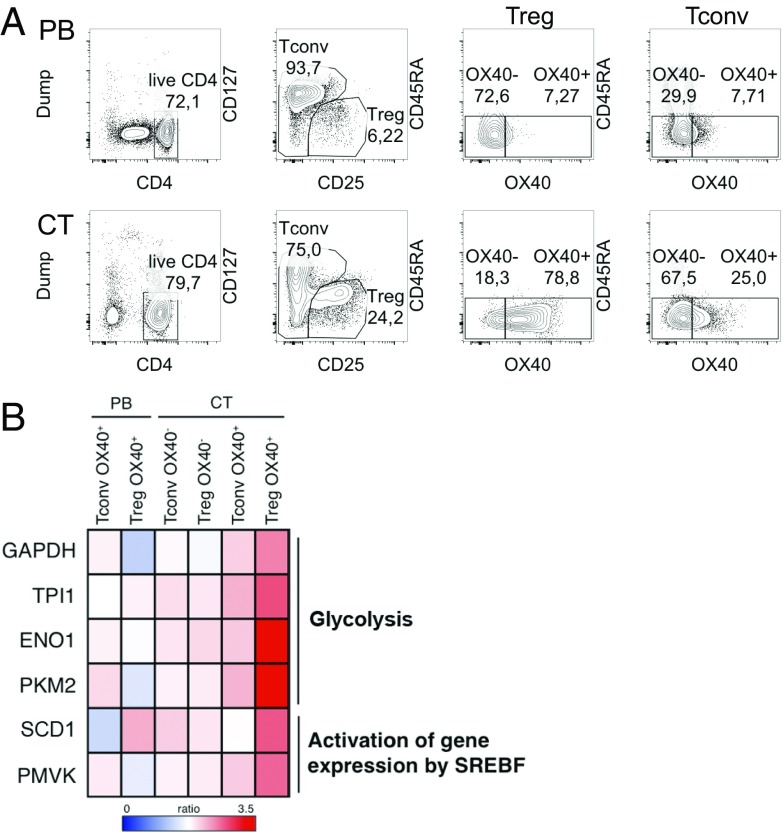
The tumor microenvironment restrains conventional T cell (Tconv) activation while facilitating the expansion of Tregs. Here we showed that Tregs' advantage in the tumor milieu relies on supplemental energetic routes involving lipid metabolism. In murine models, tumor-infiltrating Tregs displayed intracellular lipid accumulation, which was attributable to an increased rate of fatty acid (FA) synthesis. Since the relative advantage in glucose uptake may fuel FA synthesis in intratumoral Tregs, we demonstrated that both glycolytic and oxidative metabolism contribute to Tregs' expansion. We corroborated our data in human tumors showing that Tregs displayed a gene signature oriented toward glycolysis and lipid synthesis. Our data support a model in which signals from the tumor microenvironment induce a circuitry of glycolysis, FA synthesis, and oxidation that confers a preferential proliferative advantage to Tregs, whose targeting might represent a strategy for cancer treatment.

Keywords: Treg; fatty acid synthesis; glycolysis; ox40; tumor microenvironment.


Conflict of interest statement

The authors declare no conflict of interest.

Figures

Fig. 1.
Fig. 1.
Expanded and activated tumor-infiltrating Tregs display high intracellular lipid content. MCA38 cells (5 × 10⁵) were injected s.c. into C57BL/6 mice, and flow cytometry analysis was performed on lymphocytes extracted from spleen (SPL) and tumor (TUM) after 14 d. (A) Frequency of CD25+Foxp3+ Tregs in gated CD4+ lymphocytes. (B and C) Frequency of cells expressing Ki67 (B) and geometric mean fluorescent intensity (gMFI) of OX40 in gated CD25+Foxp3+ Tregs (red bars) and CD25Foxp3 Tconvs (blue bars) (C) in spleens (empty bars) and tumors (filled bars) from tumor-bearing mice. (D and E) Representative histograms (D) and gMFI analysis (E) of Bodipy incorporation in gated CD25+Foxp3+ Tregs (red peaks and bars) and CD25Foxp3 Tconvs (blue peaks and bars) in spleen (empty peaks and bars) and tumor (solid peaks and bars) from tumor-bearing mice. Peaks in gray represent the fluorescence-minus-one (FMO) controls. (F) Ratio of Bodipy gMFI between Tregs and Tconvs from spleen and tumor. Error bars show mean ± SEM; each dot corresponds to a single mouse. Data shown are from one representative of two independent experiments. *P < 0.05, **P < 0.01, ***P < 0.005 by paired Student t test between Tregs and Tconvs in the same samples and by unpaired Student t test between populations of different samples.
Fig. 2.
Fig. 2.
OX40 triggering alone recapitulates Treg proliferation and FA accumulation in vivo. C57BL/6 naive mice were injected i.p. with 500 μg of anti-OX40 agonist mAb (OX86) or PBS as a mock control. After 6 d, flow cytometry analysis was performed in splenocytes. (A) Frequency of CD25+Foxp3+ Tregs in gated CD4+ lymphocytes. (BD) Frequency of cells expressing Ki67 (B), gMFI analysis of OX40 (C), and gMFI analysis of Bodipy incorporation (D) in gated CD25+Foxp3+ Tregs (red bars) and CD25Foxp3 Tconvs (blue bars) in αOX40-treated (solid bars) and mock-treated (open bars) mice. (E) Representative histograms showing Bodipy labeling in gated Ki67+ or Ki67 Tregs or Tconvs; numbers indicate Bodipy gMFI; peaks in gray represent the FMO controls. Error bars show mean ± SEM; each dot corresponds to a single mouse; six to seven mice were included in each experimental group. *P < 0.05, **P < 0.01, ***P < 0.005 by paired Student t test between Tregs and Tconvs in the same samples and by unpaired Student t test between populations of different samples.
Fig. 3.
Fig. 3.
FAS, rather than FA uptake, shapes the lipid Treg pool and contributes to Treg proliferation. Mice bearing tumors 8 × 8 mm in size received an i.p. injection of the green fluorescent palmitate (Bodipy FL C16) 1 h before spleen and tumor collection. Then Bodipy FL C16 uptake and CD36 expression were quantified by flow cytometry in CD25+Foxp3+ Tregs and CD25Foxp3 Tconvs. (A and B) Representative histograms (A) and frequency of cells expressing CD36 (B) in gated Tregs (red peaks and bars) and Tconvs (blue peaks and bars) in spleen (empty peaks and bars) and tumor (solid peaks and bars). (C) Ratio of the frequency of CD36-expressing Tregs and Tconvs in spleen and tumor. (D and E) Representative histograms (D) and gMFI of Bodipy FL C16 acquisition (E) in gated Tregs (red peaks and bars) and Tconvs (blue peaks and bars) in spleen (empty peaks and bars) and tumor (solid peaks and bars). (F) Ratio between Bodipy FL C16 gMFI of Tregs and Tconvs in spleen and tumor tissue. Peaks in gray represent the FMO controls. (G and H) The expression level of Pparg, Acacb, and Cpt1a mRNA was assessed by the PrimeFlow RNA assay in gated CD4+CD25+ Tregs and CD4+CD25 Tconvs. (G) gMFI of each gene expression in Tregs (red bars) and Tconvs (blue bars) in spleen (empty bars) and tumor (filled bars). (H) Representative overlay contour plots of Acacb- and Pparg-coexpressing cells in the indicated samples. Each dot corresponds to a single mouse; data shown are from one representative of four independent experiments, each including three to seven mice per group. Error bars show mean ± SEM; *P < 0.05, **P < 0.01, by paired Student t test between Tregs and Tconvs in the same sample and by unpaired Student t test between populations of different samples.
Fig. 4.
Fig. 4.
Inhibition of FAS blocks proliferation and lipid accumulation preferentially in Tregs in vitro. (AC) CD4+CD25+ Tregs, magnetically purified from splenocytes of naive C57BL/6 mice, were labeled with eFluor670 and polyclonally stimulated for 4 d and then were stained with Bodipy and analyzed by flow cytometry. (A) Representative histograms of eFluor670 dilution (Left) and Bodipy incorporation (Right) in Tregs cultured with different IL-2 concentrations. (B) Representative plot of the proliferating and resting Treg gating strategy (Left) and a representative histogram of Bodipy incorporation within each gate (Right). (C) Mean fluorescence intensity (MFI) of eFluor670 in gated Tregs (Upper) and gMFI of Bodipy incorporation in gated resting and proliferating Tregs (Lower) cultured with different TOFA concentrations. (D and E) Magnetically purified Tregs and Tconvs were cocultured at a 1:1 ratio with feeder cells, anti-CD3, and IL-2, with or without TOFA (5 μg/mL). After 4 d, cells were stained with Bodipy and Foxp3, and flow cytometry analysis was performed in gated Tregs (Foxp3+, red) or Tconvs (Foxp3, blue). (D) Representative overlay of Tregs and Tconvs in the indicated conditions; numbers indicate MFI of eFluor670 or gMFI of Bodipy. (E) Analysis of eFluor670 MFI or Bodipy gMFI (gated on proliferating cells) of Tregs (red bars) or Tconvs (blue bars), either mock-treated (empty bars) or TOFA-treated (filled bars). Each condition was tested in triplicate; data shown are from one representative of two independent experiments. Error bars show mean ± SEM; *P < 0.05, **P < 0.01, ***P < 0.005 by unpaired Student t test.
Fig. 5.
Fig. 5.
Glucose uptake and usage occur preferentially in Tregs in tumors. Mice bearing tumors 8 × 8 mm in size received an i.p. injection of the fluorescent glucose analog 2-NBDG, and spleens and tumors were collected 15 min after injection. 2-NBDG uptake and GLUT1 expression were quantified by flow cytometry in CD25+Foxp3+ Tregs and CD25Foxp3 Tconvs. (A and B) Representative histograms (A) and frequency of cells expressing GLUT1 (B) in gated Tregs (red peaks and bars) and Tconvs (blue peaks and bars) in spleen (empty peaks and bars) and tumor (solid peaks and bars); gray peaks represent the FMO controls. (C) Ratio between frequency of GLUT1-expressing Tregs and Tconvs in spleen and tumor. (D and E) Representative histograms (D) and MFI of 2-NBDG acquisition (E) in gated Tregs (red peaks and bars) and Tconvs (blue peaks and bars) in spleen (empty peaks and bars) and tumor (solid peaks and bars). (F) Ratio between 2-NBDG MFI of Tregs versus Tconvs at different sites. (G) Expression levels of the glycolysis-related genes Hk2, Gapdh, and Eno1, evaluated through the PrimeFlow RNA assay in gated CD4+CD25+ Tregs (red bars) and CD4+CD25 Tconvs (blue bars) from spleen (empty bars) and tumor (filled bars). Each dot corresponds to a single mouse; data shown are from one representative of three independent experiments each including three to seven mice. Error bars show mean ± SEM; *P < 0.05, **P < 0.01, ***P < 0.005, by paired Student t test between Tregs and Tconvs in the same sample and by unpaired Student t test between populations of different samples.
Fig. 6.
Fig. 6.
TUM-Tregs display higher levels of both glycolytic and oxidative metabolism. (A) CD4+CD25+ Tregs and CD4+CD25 Tconvs were magnetically purified from pooled spleens and tumors of tumor-bearing mice, and metabolomic profiling was performed directly ex vivo by LC-MS/MS. The heatmap displays the levels of each metabolite (in femtograms per cell) in the indicated samples (minimum/maximum related to each metabolite). G6P/F6P, glucose 6P/fructose 6P; Ribu5P/Ribo5P/Xilu5P, Ribulose 5P/Ribose 5P/Xilulose 5P; DHAP/GAP, dihydroxyacetone phosphate/glyceraldehyde phosphate. (BE) CD4+CD25+ Tregs and CD4+CD25 Tconvs were magnetically purified from pooled spleens and tumors of tumor-bearing mice, and quantification of the ECAR (B) and OCR (C) was performed by Seahorse analysis after a 12-h stimulation with anti-CD3/anti-CD28. (B) Basal glycolysis, (C) basal OxPhos, and (D and E) respective Treg/Tconv ratios for each index, in the indicated conditions. Data shown are from one representative of two independent experiments. Data are expressed as mean ± SEM of three measurements, each collected in two to eight replicates. **P < 0.01, ***P < 0.005, by unpaired Student t test. (F) Magnetically purified Tregs and Tconvs were cocultured at a 1:1 ratio for 4 d with or without Etx (100 μM) or 2-DG (1 mM), stained with Bodipy and Foxp3, and analyzed by flow cytometry. Analysis of eFluor670 MFI or Bodipy gMFI (gated on proliferating cells) in Tregs (red bars) or Tconvs (blue bars) is shown in the indicated conditions. Data are shown as mean ± SEM; each condition was tested in triplicate; data shown are from one representative of two independent experiments. *P < 0.05, **P < 0.01, ***P < 0.005, by unpaired Student t test.
Fig. 7.
Fig. 7.
Human Treg proliferation ex vivo from diseased liver is associated with glycolytic and FAS-related gene expression. OX40+/OX40 CD45RAlow Tregs and Tconvs were extracted and sorted from the PB and CT of five patients with chronic HCV infection, and gene expression analysis was performed. (A) Sorting strategy. (B) The fold-change was calculated for each gene over the respective control (OX40 PB Tconvs for all Tconv samples and OX40 PB Tregs for all Treg samples), and 216 genes up-regulated more than twofold only in Treg OX40+ CT were selected for pathway analysis (https://reactome.org/). The heatmap displays the fold-change over control in the genes accounting for two pathways of interest among those showing statistically significant enrichment (P < 0.05).

References

    1. Roychoudhuri R, Eil RL, Restifo NP. The interplay of effector and regulatory T cells in cancer. Curr Opin Immunol. 2015;33:101–111. - PubMed
    1. Burocchi A, Colombo MP, Piconese S. Convergences and divergences of thymus- and peripherally derived regulatory T cells in cancer. Front Immunol. 2013;4:247. - PMC - PubMed
    1. Kretschmer K, et al. Inducing and expanding regulatory T cell populations by foreign antigen. Nat Immunol. 2005;6:1219–1227. - PubMed
    1. Weiss JM, et al. Neuropilin 1 is expressed on thymus-derived natural regulatory T cells, but not mucosa-generated induced Foxp3+ T reg cells. J Exp Med. 2012;209:1723–1742, S1. - PMC - PubMed
    1. Zhou G, Levitsky HI. Natural regulatory T cells and de novo-induced regulatory T cells contribute independently to tumor-specific tolerance. J Immunol. 2007;178:2155–2162. - PubMed

Publication types

MeSH terms