. 2018 Sep;17(9):1864-1874.
doi: 10.1074/mcp.TIR118.000686. Epub 2018 Jun 24.

Spatially Resolved Proteome Mapping of Laser Capture Microdissected Tissue with Automated Sample Transfer to Nanodroplets

Affiliations

Spatially Resolved Proteome Mapping of Laser Capture Microdissected Tissue with Automated Sample Transfer to Nanodroplets

Ying Zhu et al. Mol Cell Proteomics. 2018 Sep.

Abstract

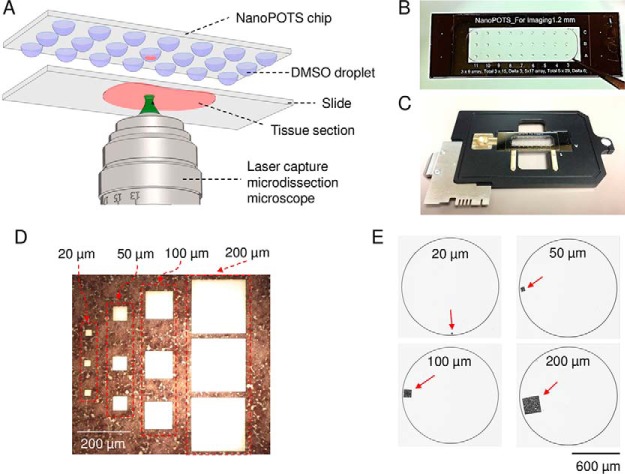
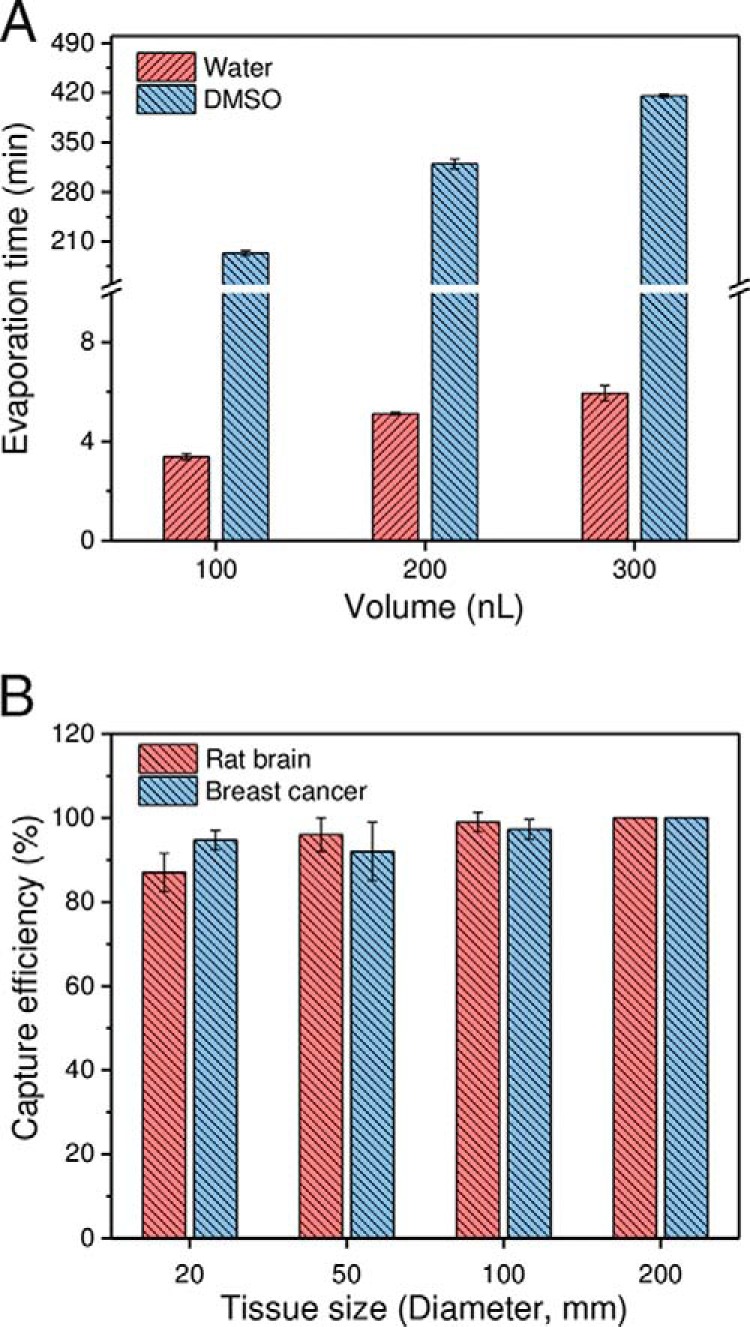
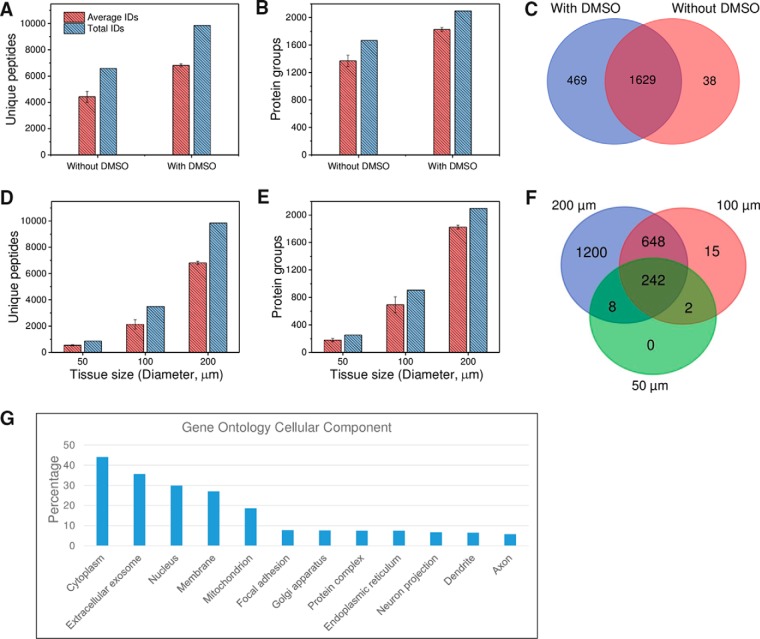
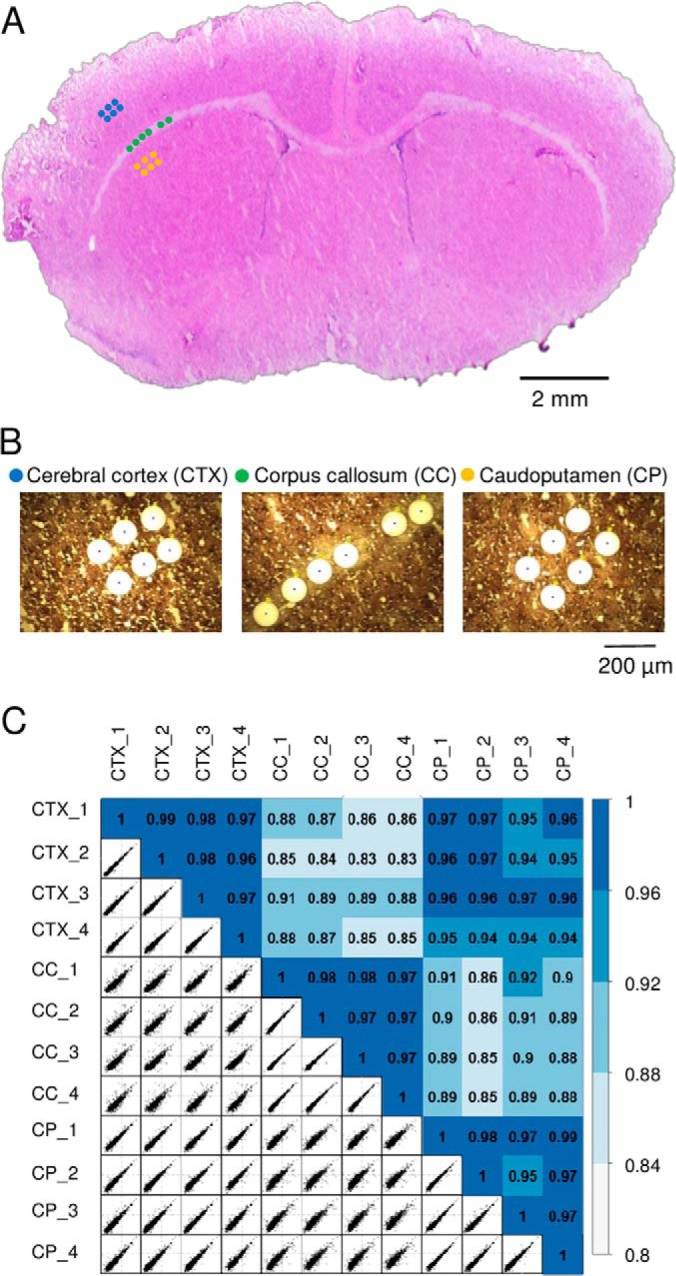
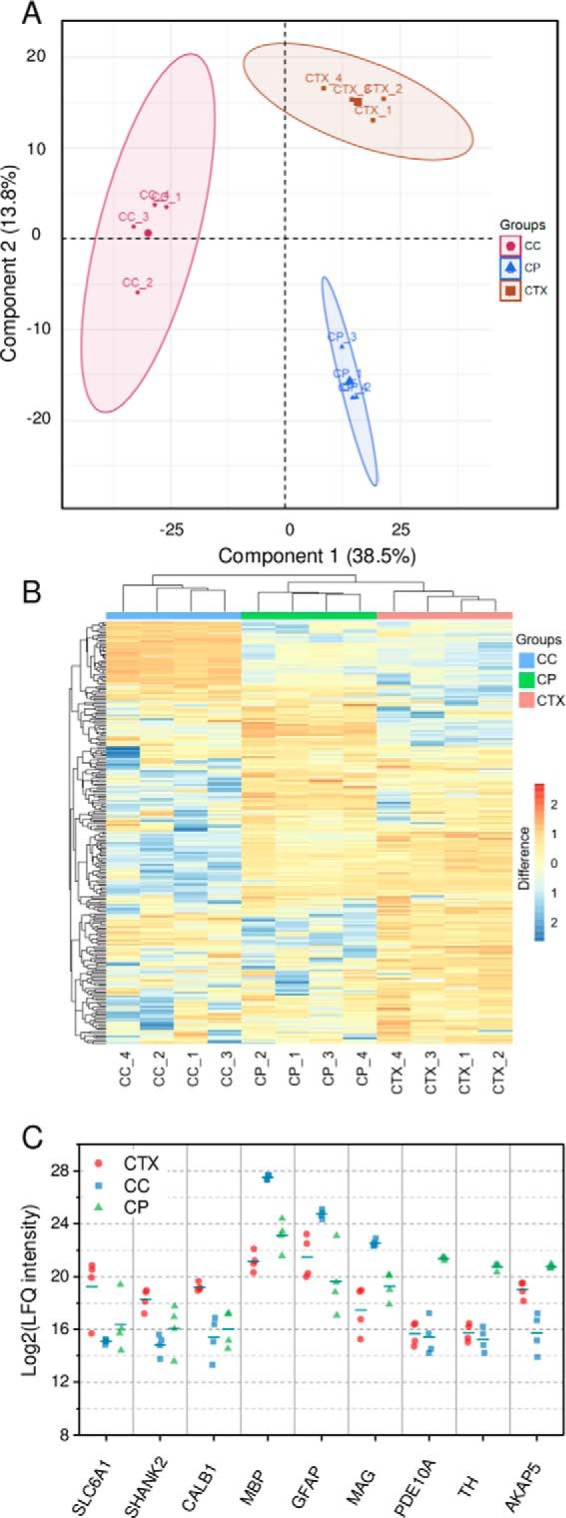
Current mass spectrometry (MS)-based proteomics approaches are ineffective for mapping protein expression in tissue sections with high spatial resolution because of the limited overall sensitivity of conventional workflows. Here we report an integrated and automated method to advance spatially resolved proteomics by seamlessly coupling laser capture microdissection (LCM) with a recently developed nanoliter-scale sample preparation system termed nanoPOTS (Nanodroplet Processing in One pot for Trace Samples). The workflow is enabled by prepopulating nanowells with DMSO, which serves as a sacrificial capture liquid for microdissected tissues. The DMSO droplets efficiently collect laser-pressure catapulted LCM tissues as small as 20 μm in diameter with success rates >87%. We also demonstrate that tissue treatment with DMSO can significantly improve proteome coverage, likely due to its ability to dissolve lipids from tissue and enhance protein extraction efficiency. The LCM-nanoPOTS platform was able to identify 180, 695, and 1827 protein groups on average from 12-μm-thick rat brain cortex tissue sections having diameters of 50, 100, and 200 μm, respectively. We also analyzed 100-μm-diameter sections corresponding to 10-18 cells from three different regions of rat brain and comparatively quantified ∼1000 proteins, demonstrating the potential utility for high-resolution spatially resolved mapping of protein expression in tissues.


Figures

Fig. 1.
Fig. 1.
A, schematic diagram showing the direct integration of LCM with nanoPOTS using DMSO droplets for tissue capture. B, Image of a nanoPOTS chip with an array of 200-nL prepopulated DMSO droplets. C, Direct mounting of a nanoPOTS chip on a slide adapter for a PALM MicroBeam LCM system. D, Microdissected tissue section and E, the corresponding tissue pieces collected in nanowells with square lateral dimensions from 20 μm to 200 μm. A 12-μm-thick rat brain coronal section was used as model sample.
Fig. 2.
Fig. 2.
A, comparison of evaporation times for water and DMSO droplets. n = 5 for each condition. B, Evaluation of the capture efficiency of LCM tissue samples using DMSO droplets. A patient-derived xenograft and a rat brain section (12 μm thick) were used as model samples. The replicate numbers were 75, 75, 75, and 27 for tissues having lateral dimensions of 20 μm, 50 μm, 100 μm, and 200 μm, respectively. 200 nL DMSO droplets pre-deposited in nanowells with a diameter of 1.2 mm were used for tissue collection.
Fig. 3.
Fig. 3.
A–C, unique peptide (A) and protein (B) identifications for rat brain cortex tissue samples obtained by LCM followed by DMSO and DMSO-free sample collection. C, Venn diagram of total protein identifications. Tissue size: 200 μm in diameter and 12 μm in depth. D–F, Evaluation of the sensitivity of the LCM-nanoPOTS system in proteomic analysis of small rat cortex tissue samples. The relationship between tissue size and unique peptide (D) and protein (E) identifications, and (F) the overlap of total protein identifications in different sizes. G, Gene Ontology cellular component analysis of the 2098 proteins identified from 200-μm cortex tissues using the online tool DAVID (42). All peptide and protein identifications were based on MS/MS spectra with Match Between Runs disabled. Each condition was analyzed in triplicate.
Fig. 4.
Fig. 4.
A, the 12-μm-thick rat brain coronal section used in the study. Three distinct regions including cerebral cortex (CTX), corpus callosum (CC), and caudoputamen (CP) were dissected with a spatial resolution of 100 μm in diameter. B, The corresponding microscopic images of the tissue regions after dissection. C, Pairwise correlation plots with log2-transformed LFQ intensities between 12 tissue samples from the three regions. The color codes indicate the relatively high correlations between the same tissue regions and relatively low correlations between different regions.
Fig. 5.
Fig. 5.
A, principle component analysis of protein expression in CTX, CC, and CP regions of rat brain section as shown in Fig. 4. B, Hierarchical clustering analysis (HCA) of the significant proteins. C, A panel of selected differentially expressed proteins among the three regions.

References

    1. Satija R., Farrell J. A., Gennert D., Schier A. F., and Regev A. (2015) Spatial reconstruction of single-cell gene expression data. Nat. Biotechnol. 33, 495–502 - PMC - PubMed
    1. Crosetto N., Bienko M., and van Oudenaarden A. (2014) Spatially resolved transcriptomics and beyond. Nat. Rev. Genet. 16, 57–66 - PubMed
    1. Lein E., Borm L. E., and Linnarsson S. (2017) The promise of spatial transcriptomics for neuroscience in the era of molecular cell typing. Science 358, 64–69 - PubMed
    1. Ståhl P. L., Salmén F., Vickovic S., Lundmark A., Navarro J. F., Magnusson J., Giacomello S., Asp M., Westholm J. O., Huss M., Mollbrink A., Linnarsson S., Codeluppi S., Borg Å Pontén F, Costea P. I., Sahlén P., Mulder J., Bergmann O., Lundeberg J., and Frisén J. (2016) Visualization and analysis of gene expression in tissue sections by spatial transcriptomics. Science 353, 78–82 - PubMed
    1. Van de Plas R., Yang J., Spraggins J., and Caprioli R. M. (2015) Image fusion of mass spectrometry and microscopy: a multimodality paradigm for molecular tissue mapping. Nat. Methods 12, 366–372 - PMC - PubMed

Publication types