. 2018 Jul;20(7):782-788.
doi: 10.1038/s41556-018-0125-0. Epub 2018 Jun 25.

Aspartate is an endogenous metabolic limitation for tumour growth

Affiliations

Aspartate is an endogenous metabolic limitation for tumour growth

Lucas B Sullivan et al. Nat Cell Biol. 2018 Jul.

Abstract

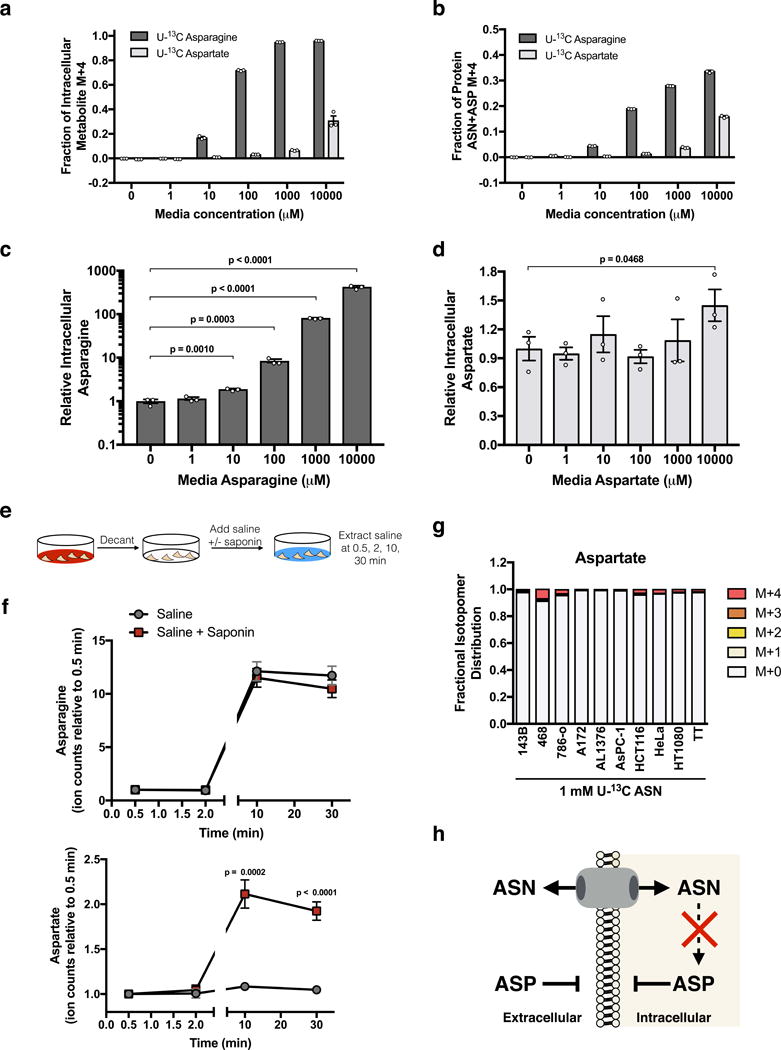
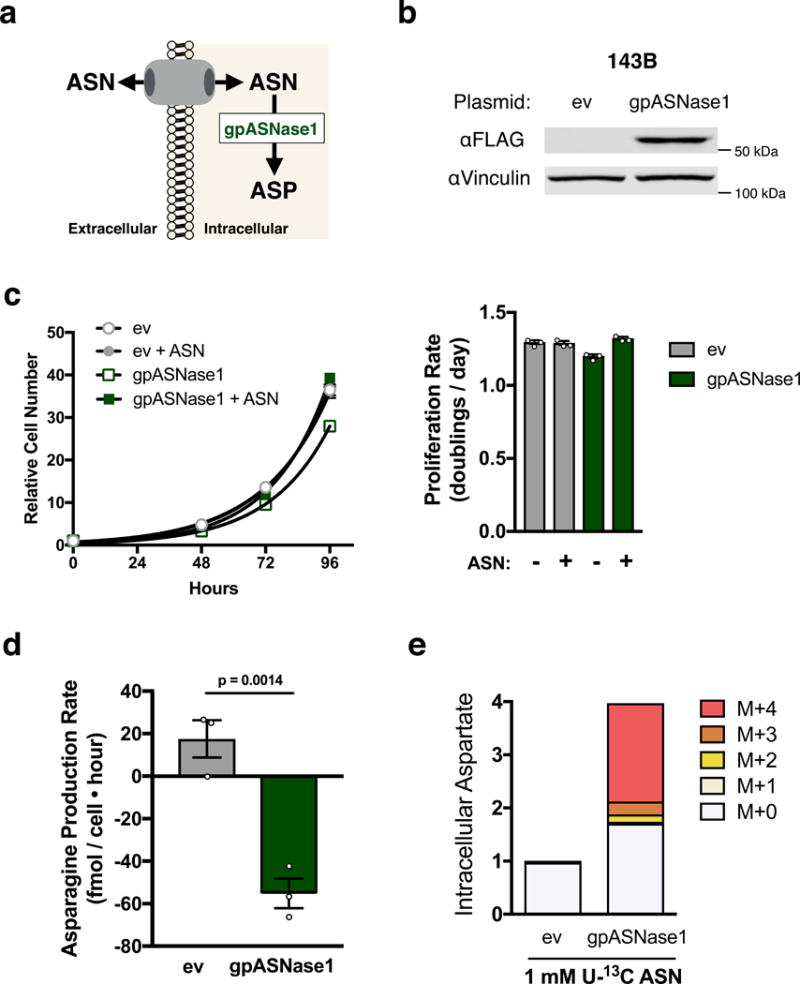
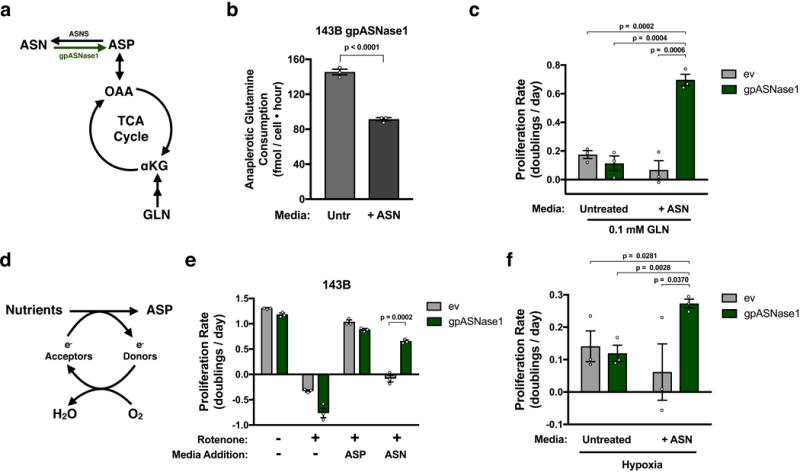
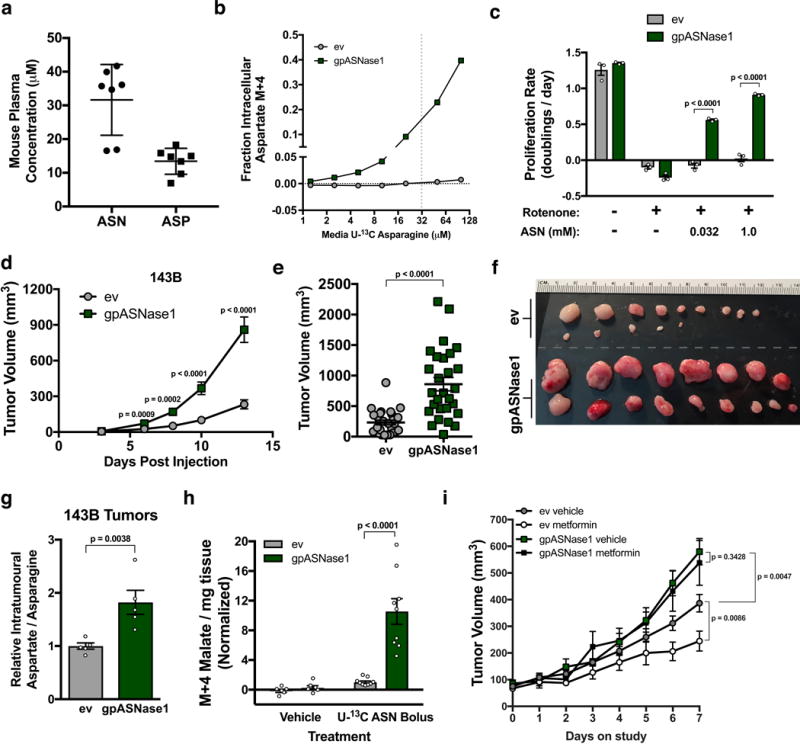
Defining the metabolic limitations of tumour growth will help to develop cancer therapies1. Cancer cells proliferate slower in tumours than in standard culture conditions, indicating that a metabolic limitation may restrict cell proliferation in vivo. Aspartate synthesis can limit cancer cell proliferation when respiration is impaired2-4; however, whether acquiring aspartate is endogenously limiting for tumour growth is unknown. We confirm that aspartate has poor cell permeability, which prevents environmental acquisition, whereas the related amino acid asparagine is available to cells in tumours, but cancer cells lack asparaginase activity to convert asparagine to aspartate. Heterologous expression of guinea pig asparaginase 1 (gpASNase1), an enzyme that produces aspartate from asparagine5, confers the ability to use asparagine to supply intracellular aspartate to cancer cells in vivo. Tumours expressing gpASNase1 grow at a faster rate, indicating that aspartate acquisition is an endogenous metabolic limitation for the growth of some tumours. Tumours expressing gpASNase1 are also refractory to the growth suppressive effects of metformin, suggesting that metformin inhibits tumour growth by depleting aspartate. These findings suggest that therapeutic aspartate suppression could be effective to treat cancer.


Figures

Figure 1
Figure 1. Extracellular asparagine, but not aspartate, is accessible to cells
(a) Fractional labeling of intracellular asparagine and aspartate in 143B cells after 1 hour of exposure to the indicated concentrations of U-13C labeled asparagine or U-13C labeled aspartate. (b) Fractional labeling of total asparagine plus aspartate in protein hydrolysates derived from 143B cells cultured for 24 hours with the indicated concentrations of U-13C labeled asparagine or U-13C labeled aspartate as indicated. Acid hydrolysis of protein cleaves amides to carboxylic acids and converts all asparagine to aspartate. Thus, the labeled aspartate measured represents the sum of labeled aspartate and asparagine in protein in these cells. (c) Intracellular asparagine levels from 143B cells cultured in the indicated concentrations of asparagine for 1 hour. (d) Intracellular aspartate levels from 143B cells cultured in the indicated concentrations of aspartate for 1 hour. (e) Schematic detailing the saponin-specific metabolite release assay used in f and Supplementary Fig. 1g. (f) Saponin-specific metabolite release of asparagine (top) and aspartate (bottom). (g) Fractional labeling of intracellular aspartate from the indicated cancer cell lines cultured with 1 mM U-13C asparagine for 24 hours. (h) Schematic summarizing the permeability of asparagine (ASN) and aspartate (ASP), and the inability of cells to convert ASN to ASP. p values were calculated by unpaired one-tailed t test (c, d, f). Values denote mean ± SEM. Sample size (n) = 3 independent biological replicates from a single representative experiment (a-d, f, g). Source data for f and g are available in Supplementary Table 1.
Figure 2
Figure 2. Heterologous expression of guinea pig asparaginase 1 confers asparaginase activity to cells
(a) Schematic depicting how intracellular expression of gpASNase1 allows environmental asparagine to support intracellular aspartate levels. (b) Western blot analysis of 143B cells expressing empty vector (ev) or FLAG-tagged gpASNase1 as indicated. gpASNase1 expression is detected with an anti-FLAG antibody, and vinculin expression is also shown as a loading control. Predicted molecular weight of gpASNase1 is 60 kDa. This experiment was repeated with similar results 4 times. (c) Relative cell number over time of 143B cells expressing ev or gpASNase1, in the presence or absence of 1 mM asparagine as indicated (left). These data were used to calculate proliferation rate (right). (d) Asparagine production/consumption rate of 143B cells expressing ev or gpASNase1 cultured in 1 mM asparagine as indicated. p value was calculated by unpaired one-tailed t test. (e) Measurement of aspartate levels (magnitude of bars) and fractional isotopomer labeling (colored segments) of ev or gpASNase1-expressing 143B cells cultured with 1 mM U-13C labeled asparagine for 24 hours. Values denote mean ± SEM. Sample size (n) = 3 independent biological replicates from a single representative experiment (c-e). Source data for c and e are available in Supplementary Table 1.
Figure 3
Figure 3. gpASNase1 expression allows extracellular asparagine to support proliferation under conditions where aspartate is limiting
(a) Schematic indicating the relationship between glutamine (GLN) metabolism and aspartate(ASP)/asparagine(ASN) metabolism and the tricarboxylic acid (TCA) cycle. α-ketoglutarate (αKG); Oxaloacetic acid (OAA); asparagine synthetase (ASNS). (b) Anaplerotic glutamine consumption (glutamine consumption rate – glutamate release rate) from media when 143B gpASNase1 cells are cultured in the presence or absence of 1 mM asparagine as indicated. (c) Proliferation rate of 143B cells expressing empty vector (ev) or gpASNase1 when cultured in 0.1 mM glutamine in the presence or absence of 1 mM asparagine as indicated. (d) Schematic depicting the requirement for electron acceptors to produce aspartate. (e) Proliferation rate of 143B cells expressing empty vector (ev) or gpASNase1, with or without 120 nM rotenone, and cultured in media with or without 20 mM aspartate or 1 mM asparagine as indicted. (f) Proliferation rate of 143B cells expressing empty vector (ev) or gpASNase1 when cultured in hypoxia (0.8% O2), in the presence or absence of 1 mM asparagine, as indicated. p values were calculated by unpaired one-tailed t test (b, c, e, f) Values denote mean ± SEM. Sample size (n) = 3 independent biological replicates from a single representative experiment (b, c, e, f).
Figure 4
Figure 4. Expression of gpASNase1 increases tumour growth rate and causes metformin insensitivity
(a) Concentrations of asparagine and aspartate in mouse plasma. (b) Fractional labeling of intracellular aspartate from 143B cells expressing empty vector (ev) or gpASNase1 when cultured with the indicated concentrations of U-13C asparagine for 3 hours. This experiment was repeated with similar results one time. (c) Proliferation rate of 143B cells expressing ev or gpASNase1, with or without rotenone (120 nM), and cultured in media with the indicated concentrations of asparagine. (d) Volumes of tumours derived from 143B cells expressing empty vector (ev) or gpASNase1 measured over time as indicated. (e) Tumour volumes 13 days after implantation of 143B cells expressing empty vector (ev) or gpASNase1 as indicated. (f) Tumours dissected 13 days after implantation of 143B cells expressing empty vector (ev) (top rows) and gpASNase1 (bottom rows) from a separate experiment as (d and e). (g) Relative aspartate to asparagine ratio from tumours derived from 143B cells expressing empty vector (ev) or gpASNase1 as indicated. (h) Measurement of labeled M+4 malate in tumours derived from AL1376 cells expressing ev or gpASNase1 following two boluses of either vehicle (saline) or 30 mg/ml U-13C asparagine. (i) Assessment of tumour volume over time for tumours derived from 143B cells expressing ev or gpASNase1 in mice that were treated with either vehicle (water) or 1 g/kg metformin once daily by oral gavage. Treatment was initiated in mice with size-matched tumours after reaching 45 mm3. p values were calculated by unpaired one-tailed t test (c-e, g-i). Values denote mean ± SEM. Sample size (n) = 7 independent biological replicates from a single representative experiment (a), n = 3 independent biological replicates from a single representative experiment (b, c), 10 mice were injected per genotype, with 3 injections per mouse (d-f) yielding n = 27 (ev) and n = 28 (gpASNase1), n = 5 measurements from independent tumors from each genotype (g), n = 6 (vehicle) or n = 9 (bolus) independent tumor samples from each genotype (h). For (i) 5 mice were used per group harboring 3 injection sites each, when tumours reached ≥ 45 mm3 they were put on study, occasionally resulting in multiple tumours per mouse going on study, yielding n = 6 (ev vehicle and ev metformin), n = 7 (gpASNase1 vehicle), and n = 8 (gpASNase1 metformin). Source data for b, d, and i are available in Supplementary Table 1.

Comment in

References

    1. Vander Heiden MG, DeBerardinis RJ. Understanding the Intersections between Metabolism and Cancer Biology. Cell. 2017;168:657–669. - PMC - PubMed
    1. Sullivan LB, et al. Supporting Aspartate Biosynthesis Is an Essential Function of Respiration in Proliferating Cells. Cell. 2015;162:552–63. - PMC - PubMed
    1. Gui DY, et al. Environment Dictates Dependence on Mitochondrial Complex I for NAD+ and Aspartate Production and Determines Cancer Cell Sensitivity to Metformin. Cell Metab. 2016;24:716–727. - PMC - PubMed
    1. Birsoy K, et al. An Essential Role of the Mitochondrial Electron Transport Chain in Cell Proliferation Is to Enable Aspartate Synthesis. Cell. 2015;162:540–551. - PMC - PubMed
    1. Schalk AM, Nguyen HA, Rigouin C, Lavie A. Identification and Structural Analysis of an l-Asparaginase Enzyme from Guinea Pig with Putative Tumor Cell Killing Properties. J Biol Chem. 2014;289:33175–33186. - PMC - PubMed

Publication types

MeSH terms