Comparative Study
. 2018 Jun 25;8(1):9630.
doi: 10.1038/s41598-018-27719-0.

Comparison of multi-lineage differentiation of hiPSCs reveals novel miRNAs that regulate lineage specification

Affiliations
Comparative Study

Comparison of multi-lineage differentiation of hiPSCs reveals novel miRNAs that regulate lineage specification

Lu Li et al. Sci Rep. .

Abstract

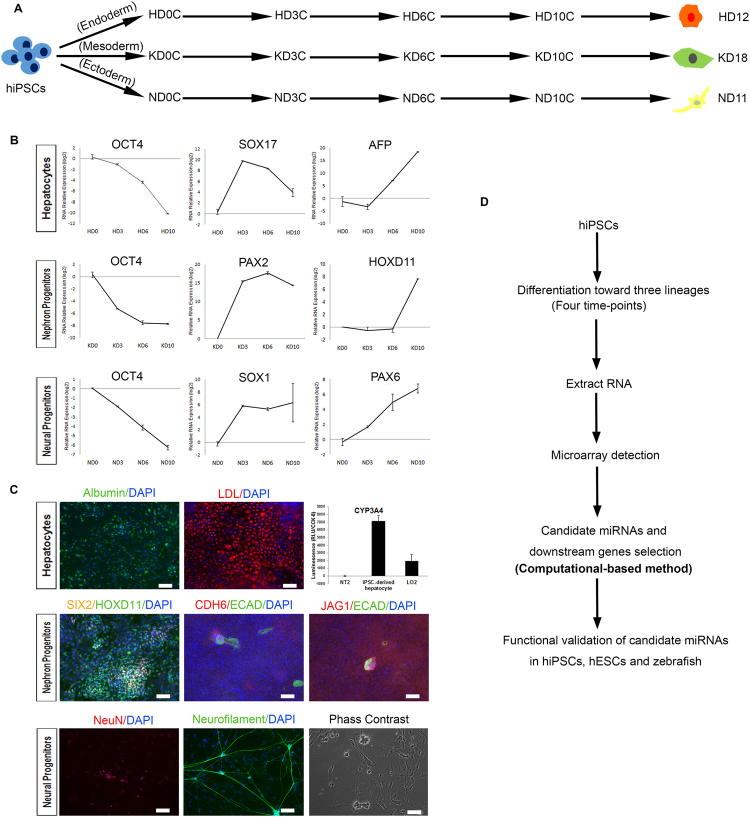
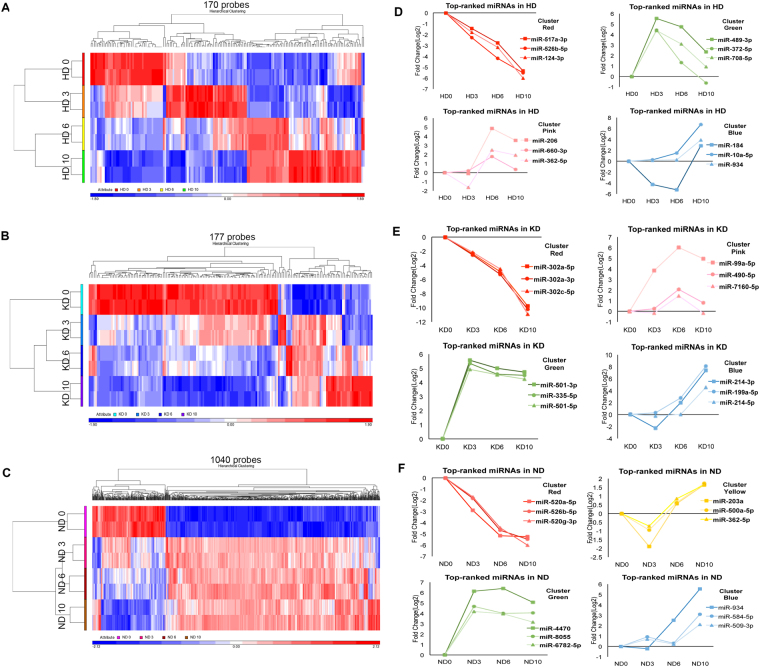
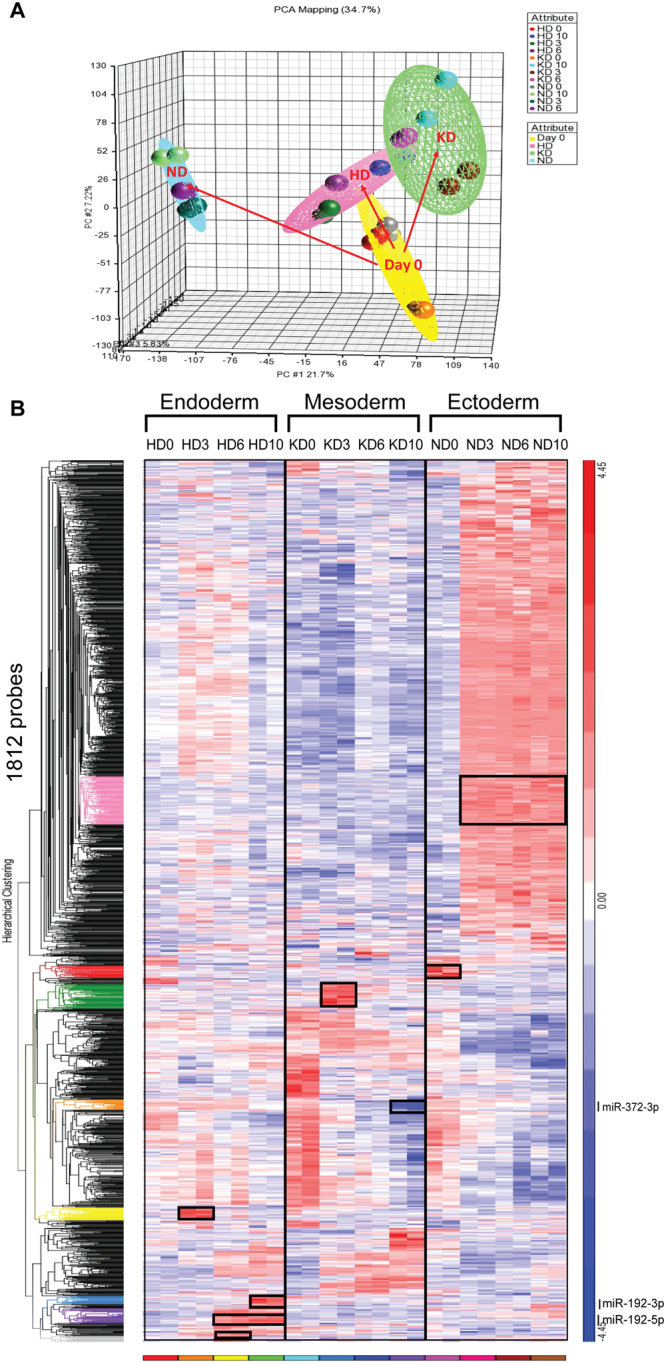
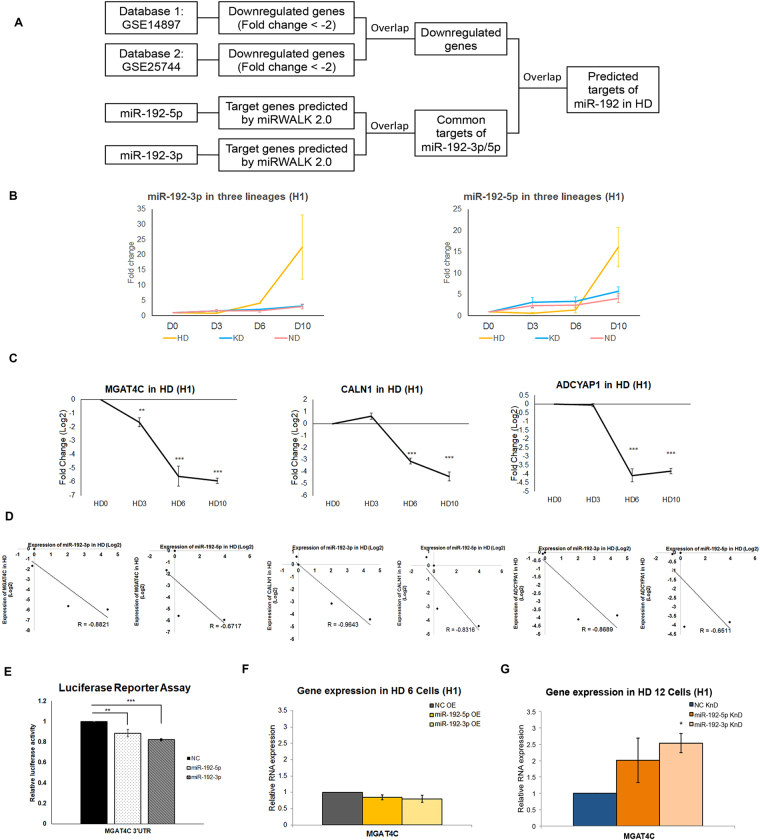
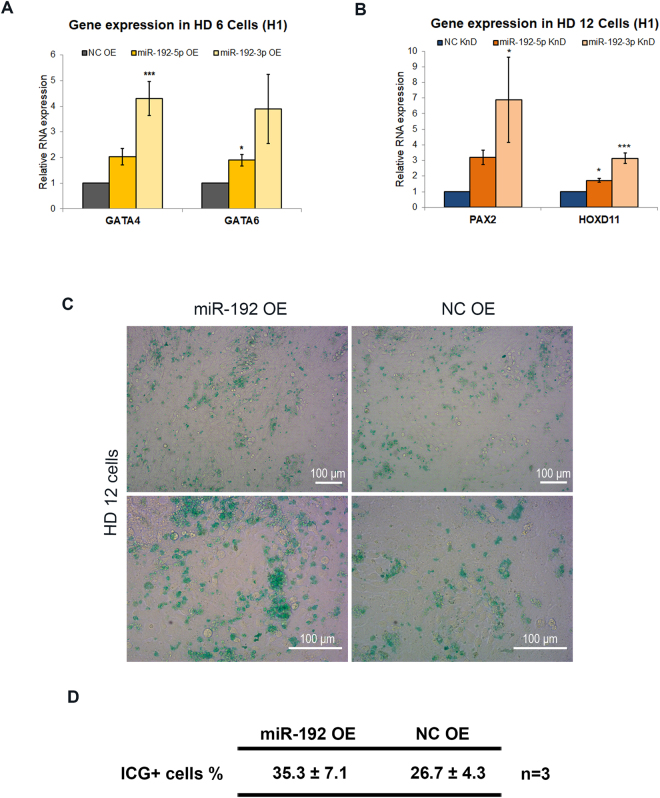
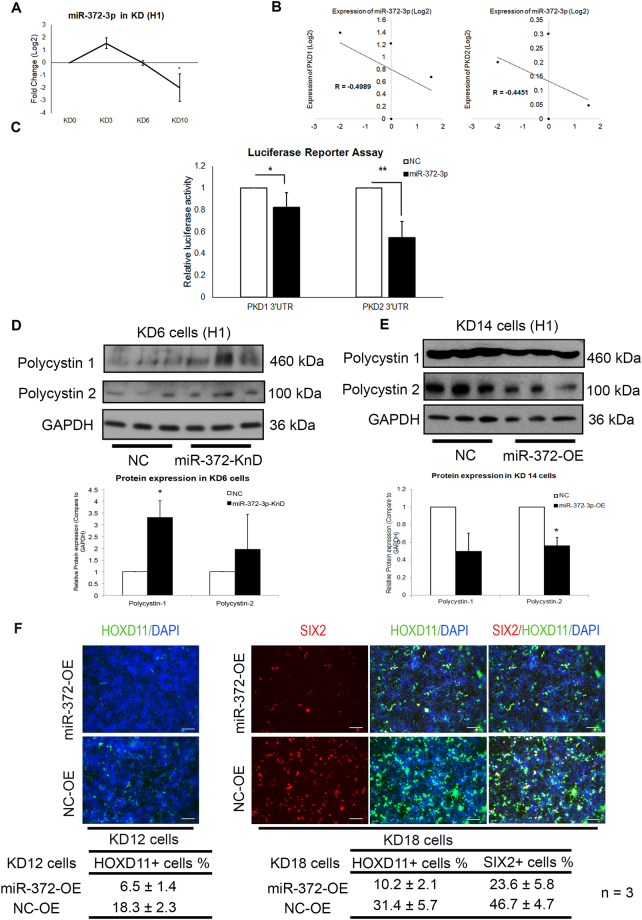
MicroRNAs (miRNAs) are known to be crucial players in governing the differentiation of human induced pluripotent stem cells (hiPSCs). Despite their utter importance, identifying key lineage specifiers among the myriads of expressed miRNAs remains challenging. We believe that the current practice in mining miRNA specifiers via delineating dynamic fold-changes only is inadequate. Our study, therefore, provides evidence to pronounce "lineage specificity" as another important attribute to qualify for these lineage specifiers. Adopted hiPSCs were differentiated into representative lineages (hepatic, nephric and neuronal) over all three germ layers whilst the depicted miRNA expression changes compiled into an integrated atlas. We demonstrated inter-lineage analysis shall aid in the identification of key miRNAs with lineage-specificity, while these shortlisted candidates were collectively known as "lineage-specific miRNAs". Subsequently, we followed through the fold-changes along differentiation via computational analysis to identify miR-192 and miR-372-3p, respectively, as representative candidate key miRNAs for the hepatic and nephric lineages. Indeed, functional characterization validated that miR-192 and miR-372-3p regulate lineage differentiation via modulation of the expressions of lineage-specific genes. In summary, our presented miRNA atlas is a resourceful ore for the mining of key miRNAs responsible for lineage specification.


Conflict of interest statement

The authors declare no competing interests.

Figures

Figure 1
Figure 1
Outline of the experimental design and summary of the multi-lineage induction. (A) Schematic overview of hiPSC differentiation into hepatocytes, nephron progenitors, and neural progenitors. (B) qPCR results showing the expression tendencies of pluripotency marker (OCT4), markers for endoderm (SOX17), mesoderm (PAX2), ectoderm (SOX1), and representative markers for hepatocytes (AFP), metanephric mesenchyme (HOXD11), and neural progenitors (PAX6) at four time-points. Values represent means ± SD (n = 2 independent cultures for each time-point). (C) Functional characterization of terminal cells, including hepatocytes (12 days), nephron progenitors (18 days) and neurons (40 days). For hepatocyte differentiation, Albumin (green fluorescence) indicates hepatocytes; LDL uptake assay indicates the LDL receptor activity in hepatocytes; and CYP450 assays show the cytochrome P450 activity of hepatocytes. For kidney differentiation, early metanephric mesenchyme marked by SIX2 (yellow fluorescence) and HOXD11 (green fluorescence), and nephron vesicles marked by CDH6 (green fluorescence), ECAD (red fluorescence) and JAG1 (red fluorescence) were induced successfully. For neuron differentiation, the nucleus and the axons of neurons were marked by NeuN (red fluorescence) and Neurofilament (green fluorescence), respectively. Phase contrast imaging showing the morphology of an induced neuron. Scale bars represent 100 μm. (D) Schematic overview of the experimental design. HD: hepatocyte differentiation; KD: nephron progenitor differentiation; ND: neural progenitor differentiation.
Figure 2
Figure 2
Intra-lineage analysis of differentially expressed miRNAs. (AC) Hierarchical clustering of 170 differentially expressed small RNAs in the first ten days of HD, 177 differentially expressed small RNAs of KD, and 1,040 differentially expressed small RNAs of ND, respectively. The values of two biological replicates (indicated in color) for each time-point are shown. (DF) The miRNAs with differential dynamics changes were plotted in different colors: small RNAs that decreased with differentiation (red); small RNAs enriched in stage 1 and 4 but downregulated at stage 2 (yellow); small RNAs increased at stage 2 but decreased at later stages (green); small RNAs enriched in stage 3 (pink); and small RNAs only increased at the latest stage (blue).
Figure 3
Figure 3
Inter-lineage analysis reveals lineage-specific miRNAs. (A) Principal component analysis (PCA) showing the unsupervised division of samples into a day 0 group (yellow sphere), an HD group (pink sphere), a KD group (green sphere) and a ND group (blue sphere). (B) Comprehensive heat map showing distinct dynamics of small RNA expression patterns during lineage specification. Colored dendrograms and black boxes indicate small RNAs that were only upregulated or downregulated in one lineage. Particularly, gray, purple, blue and yellow dendrograms indicate small RNAs that were only changed in HD. Orange and green dendrograms indicate small RNAs that were only changed in KD, Red and pink dendrograms indicate small RNAs that were only changed in ND. The newly identified key miRNAs (miR-192-3p/5p and miR-372-3p) are indicated in the dendrograms that they are included.
Figure 4
Figure 4
Identification of target genes of key miRNAs during hepatocyte differentiation. (A) Strategy for predicting common targets of miR-192-3p and miR-192-5p during HD. (B) TaqMan qPCR analysis confirming that miR-192-3p/5p were specifically upregulated during HD (n = 3 independent cultures for each time-point). (C) qPCR results showing the expression tendencies of common targets of miR-192-3p/5p during HD (n = 3 independent cultures for each time-point). (D) Correlation plot revealing reverse-correlations between miR-192-3p/5p and MGAT4C/CALN1/ADCYAP1, respectively. (E) Luciferase reporter assay confirming that miR-192-3p/5p could inhibit the 3’UTR of MGAT4C (n = 3 independent cultures for each group). (F) qPCR results showing the expression of ectodermal marker MGAT4C in HD 6 cells upon transfection of miR-192-3p/5p mimics (n = 3 independent cultures for each group). (G) qPCR results showing the expression of MGATC4C in HD 12 cells upon transfection of miR-192-3p/5p inhibitors (n = 3 independent cultures for each group). In (C), data are presented as the means ± SD. *P < 0.05, **P < 0.01, ***P < 0.001 for statistical comparisons between day 0 and other time-points (ANOVA plus Bonferroni’s post hoc test). In (EG), data are presented as the means ± SD. *P < 0.05, **P < 0.01, ***P < 0.001 for statistical comparisons between control groups and experimental groups (ANOVA plus Bonferroni’s post hoc test). OE: overexpression; KnD: Knockdown; KD: nephron progenitor differentiation; NC: non-targeting control.
Figure 5
Figure 5
Regulation of lineage-specific gene expression by lineage-specific miRNAs during hepatocyte differentiation. (A) qPCR results showing the expression of definitive endoderm markers GATA4 and GATA6 in HD 6 cells with transfection of miR-192-3p/5p mimics (n = 3 independent cultures for each group). (B) qPCR results showing the expression of intermediate mesoderm marker PAX2 and metanephric mesenchyme marker HOXD11 in HD 12 cells upon transfection of miR-192-3p/5p inhibitors (n = 3 independent cultures for each group). (C) HD 12 cells were examined by indocyanine green staining (ICG). The cells transfected with miR-192 mimics (left column) and scramble controls (right column) were compared (Scale bars represent 100 μm). (D) Table showing the percentage of ICG+ cells at HD 12 with the transfection of miR-192 mimics and non-targeting controls (data are presented as the means ± SD. n = 3 independent cultures for each group). In (A,B), data are presented as the means ± SD. *P < 0.05, **P < 0.01, ***P < 0.001 for statistical comparisons between control groups and experimental groups (ANOVA plus Bonferroni’s post hoc test). OE: overexpression; KnD: Knockdown; NC: non-targeting control.
Figure 6
Figure 6
Regulation of PKD1/PKD2 expression by lineage-specific miRNAs during nephron progenitor differentiation. (A) Taqman qPCR analysis showing the expression tendency of miR-372-3p during KD (n = 3 independent cultures for each time-point). (B) Correlation plot revealing reverse-correlations between miR-372-3p and PKD1/PKD2, respectively. (C) Luciferase reporter assay results confirming that miR-372-3p could inhibit the 3′UTR of both PKD1 and PKD2 (n = 4 independent cultures for each group). (D,E) Western blot results (upper panel) showing expression of Polycystin 1 and Polycystin 2 in KD 6 cells (D) with transfection of miR-372-3p mimics or non-targeting controls, and expression of Polycystin 1 and Polycystin 2 in KD 14 cells (E) upon transfection of miR-372-3p inhibitors or non-targeting controls. Normalized protein expressions of Polycystin 1 and Polycystin 2 are shown in lower panel (D,E). The expression of NC group of each experiment is set as 1. n = 3 independent cultures for each group. (F) KD 12 cells (left column) and KD 18 cells (right column) were examined by immunofluorescent staining (IFC) analysis. The cells transfected with miR-372-3p mimics (upper row) and scramble controls (lower row) were compared (Scale bars represent 200 μm). Table showing the percentage of HOXD11+ cells at KD 12, SIX2+ cells and HOXD11+ cells at KD 18, with the transfection of miR-372-3p mimics and non-targeting controls (data are presented as the means ± SD. n = 3 independent cultures for each group). In (A), data are presented as the means ± SD. *P < 0.05, **P < 0.01, ***P < 0.001 for statistical comparisons between day 0 and other time-points (Paired two-tailed t-test). In (CE), data are presented as the means ± SD. *P < 0.05, **P < 0.01, ***P < 0.001 for statistical comparisons between control groups and experimental groups (Paired two-tailed t-test). OE: overexpression; KnD: Knockdown; KD: nephron progenitor differentiation, NC: non-targeting control.

References

    1. Leonardo TR, Schultheisz HL, Loring JF, Laurent LC. The functions of microRNAs in pluripotency and reprogramming. Nature cell biology. 2012;14:1114–1121. doi: 10.1038/ncb2613. - DOI - PMC - PubMed
    1. Boland MJ, Nazor KL, Loring JF. Epigenetic regulation of pluripotency and differentiation. Circulation research. 2014;115:311–324. doi: 10.1161/CIRCRESAHA.115.301517. - DOI - PMC - PubMed
    1. Thiagarajan RD, Morey R, Laurent LC. The epigenome in pluripotency and differentiation. Epigenomics. 2014;6:121–137. doi: 10.2217/epi.13.80. - DOI - PubMed
    1. Miyamoto T, Furusawa C, Kaneko K. Pluripotency, Differentiation, and Reprogramming: A Gene Expression Dynamics Model with Epigenetic Feedback Regulation. PLoS computational biology. 2015;11:e1004476. doi: 10.1371/journal.pcbi.1004476. - DOI - PMC - PubMed
    1. Jung Y, Bauer G, Nolta JA. Concise review: Induced pluripotent stem cell-derived mesenchymal stem cells: progress toward safe clinical products. Stem Cells. 2012;30:42–47. doi: 10.1002/stem.727. - DOI - PMC - PubMed

Publication types