. 2018 Jun 25;8(1):9628.
doi: 10.1038/s41598-018-27376-3.

Transcriptional analysis of adipose tissue during development reveals depot-specific responsiveness to maternal dietary supplementation

Affiliations

Transcriptional analysis of adipose tissue during development reveals depot-specific responsiveness to maternal dietary supplementation

Hernan P Fainberg et al. Sci Rep. .

Abstract

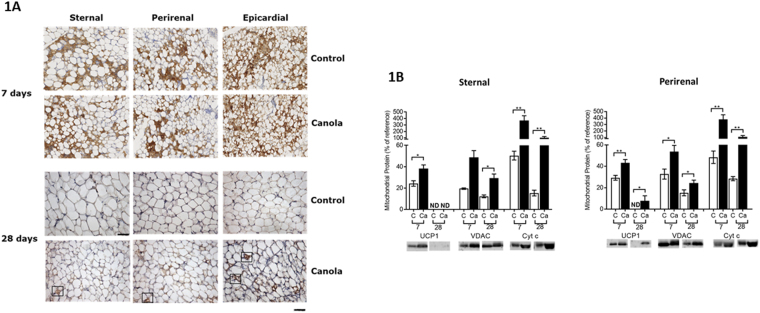
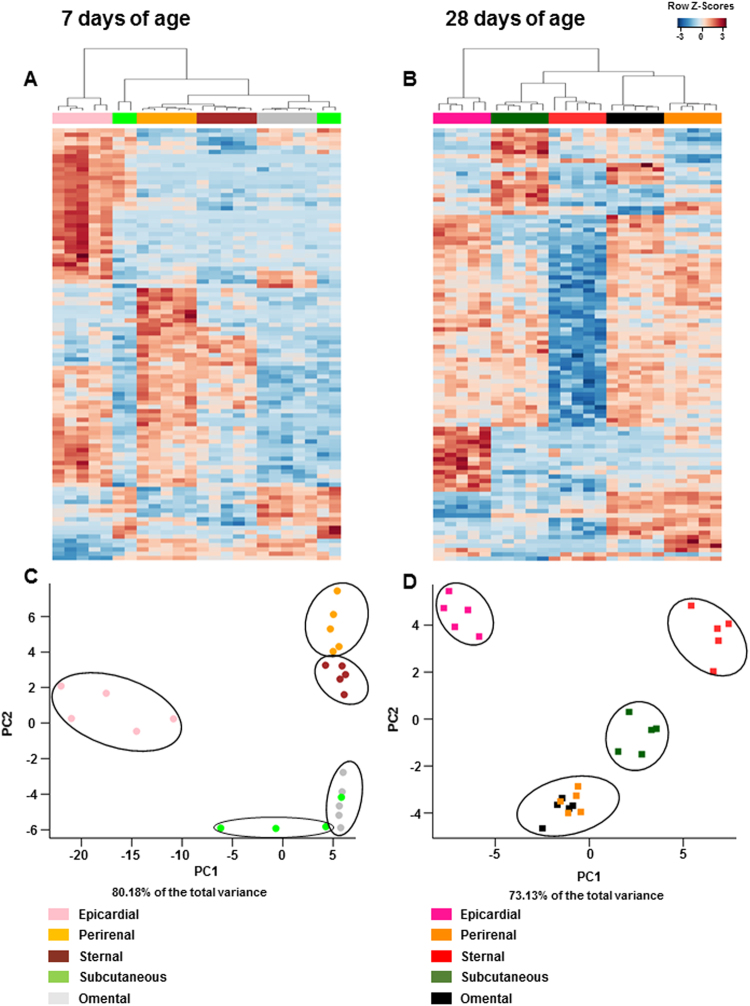
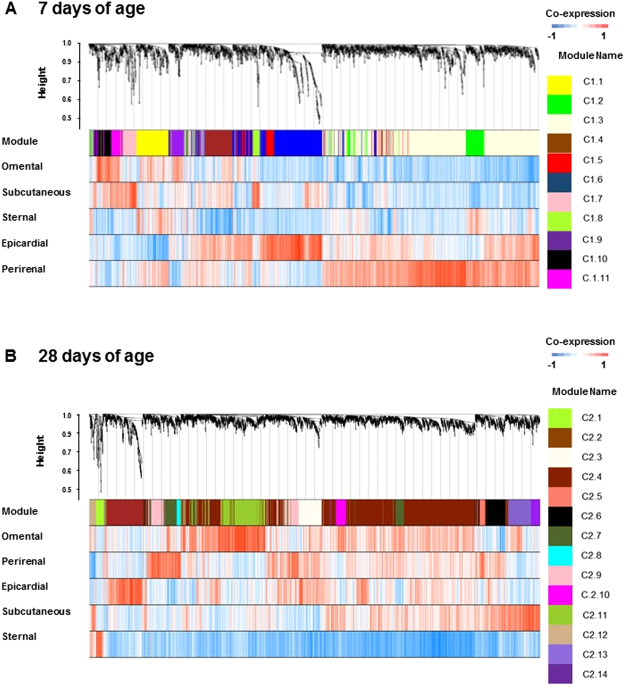
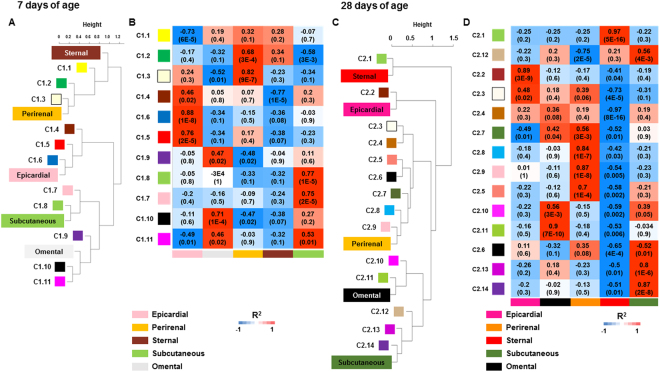
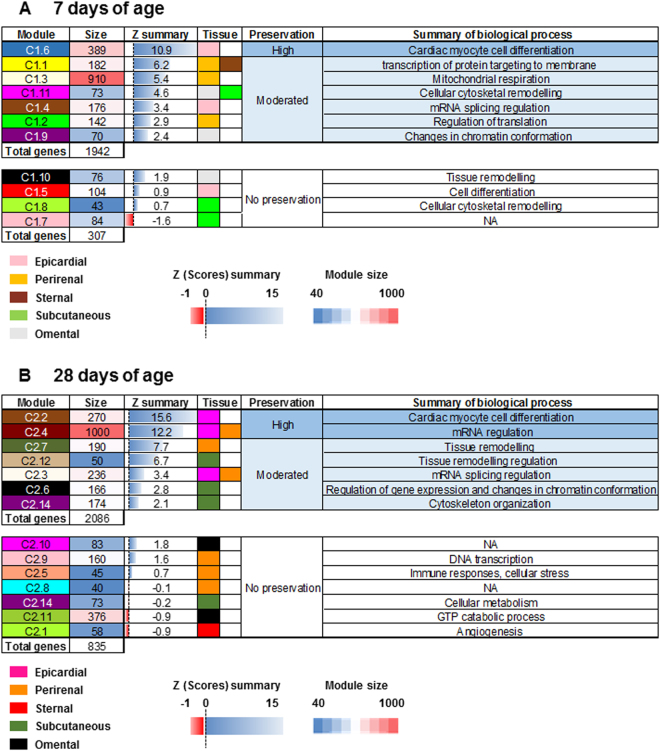
Brown adipose tissue (BAT) undergoes pronounced changes after birth coincident with the loss of the BAT-specific uncoupling protein (UCP)1 and rapid fat growth. The extent to which this adaptation may vary between anatomical locations remains unknown, or whether the process is sensitive to maternal dietary supplementation. We, therefore, conducted a data mining based study on the major fat depots (i.e. epicardial, perirenal, sternal (which possess UCP1 at 7 days), subcutaneous and omental) (that do not possess UCP1) of young sheep during the first month of life. Initially we determined what effect adding 3% canola oil to the maternal diet has on mitochondrial protein abundance in those depots which possessed UCP1. This demonstrated that maternal dietary supplementation delayed the loss of mitochondrial proteins, with the amount of cytochrome C actually being increased. Using machine learning algorithms followed by weighted gene co-expression network analysis, we demonstrated that each depot could be segregated into a unique and concise set of modules containing co-expressed genes involved in adipose function. Finally using lipidomic analysis following the maternal dietary intervention, we confirmed the perirenal depot to be most responsive. These insights point at new research avenues for examining interventions to modulate fat development in early life.


Conflict of interest statement

The authors declare no competing interests.

Figures

Figure 1
Figure 1
(A) Representative immunohistochemical detection of uncoupling protein (UCP)1 from sternal, perirenal and epicardial, sampled from 7 and 28 day old sheep. Rectangular outlines indicate clusters of uncoupling protein 1 (UCP) positive cells found in the epicardial adipose tissue at 28 days (scale bar = 50 μm; Magnification 40x) and (B) mean mitochondrial protein abundance as determined by western blotting in adipose tissue sampled from 7 and 28 day old offspring born to mothers fed a control diet (n = 5) or supplemented with 3% canola oil (n = 8). Values are means with their standard errors significant differences between dietary groups at the same age denoted by *p < 0.05; **p < 0.01. UCP, Voltage dependent anion channel 1, VDAC.
Figure 2
Figure 2
Comparison in gene expression of five adipose tissue depots at (A) 7 and (B) 28 days of age. Heat map and unsupervised hierarchical clustering dendrograms are shown for the top 100 differentially-expressed gene transcript comparisons identified by microarray analysis (average linkage, Euclidean distance metric) as selected by eBayes moderated t-statistics (FDR < 0.05). Gene expression was transformed to a Z-score, and blue represents a relative is a decrease and red an increase in gene expression between each depot at the same age. Principal component analysis (PCA) of gene expression data from five different adipose tissue depots from each animal was performed using 10055 data sets that passed the variance test QC at (C) 7 and (D) 28 days of age. Each sample is represented by a sphere (7 days) or rectangle (28 days) and color-coded to indicate the age and tissue to which it belongs.
Figure 3
Figure 3
Co-expression dendrogram analysis from the five adipose tissue depots sampled at either (A) 7 or (B) 28 days of age. In each dendrogram, the first row is subdivided into co-expressed modules founded in each age group. Rows 2 to 6 show the differential expression relationships between module genes and the adipose depot. The relationship of each gene with the assigned module is colour coded from blue (negative co-expression) to red (positive co-expression).
Figure 4
Figure 4
Summary of adipose tissue depot- and age-specific functional organisation of modules within each gene network. They were related individually by their first principal component, referred to as the module eigengene (ME). Each dendrogram illustrates the modules of co-expressed genes and their positive alignment within the ME at (A) 7 and (C) 28 days of age. The height (X-axis) indicates the magnitude of correlation expressed as Euclidean distances. Heat maps represent the correlation (and corresponding p-values) between co-expressed modules for each fat depot at (B) 7 and (D) 28 days of age. The colour scheme, from blue to red, indicates the magnitude of correlation, from low to high. Regional-specific modules identified as being highly correlated (i.e. over-expressed) for each adipose depot are shown in the columns.
Figure 5
Figure 5
Summary of cross-adipose tissue depot module preservation with age. The test uses a Z score summary of different network properties to determine gene connectivity at (A) 7 and (B) 28 days of age. Each row represents a module and each column a unique feature of each module including positive alignment with each ME and the number of genes per module. A Z summary value >2 represents a moderately preserved module, and a value >10 provides strong evidence of module preservation.

Similar articles

Cited by

References

    1. Gregg EW, Shaw JE. Global Health Effects of Overweight and Obesity. N Engl J Med. 2017;377:80–81. doi: 10.1056/NEJMe1706095. - DOI - PubMed
    1. Spalding KL, et al. Dynamics of fat cell turnover in humans. Nature. 2008;453:783–787. doi: 10.1038/nature06902. - DOI - PubMed
    1. Symonds ME, Pope M, Budge H. The Ontogeny of Brown Adipose Tissue. Annu Rev Nutr. 2015;35:295–320. doi: 10.1146/annurev-nutr-071813-105330. - DOI - PubMed
    1. Rockstroh D, et al. Direct evidence of brown adipocytes in different fat depots in children. Plos One. 2015;10:e0117841. doi: 10.1371/journal.pone.0117841. - DOI - PMC - PubMed
    1. Claussnitzer M, et al. FTO Obesity Variant Circuitry and Adipocyte Browning in Humans. N Engl J Med. 2015;373:895–907. doi: 10.1056/NEJMoa1502214. - DOI - PMC - PubMed

Publication types

MeSH terms

Substances