. 2018 Jun 25;9(1):2459.
doi: 10.1038/s41467-018-04883-5.

Translational control of depression-like behavior via phosphorylation of eukaryotic translation initiation factor 4E

Affiliations

Translational control of depression-like behavior via phosphorylation of eukaryotic translation initiation factor 4E

Argel Aguilar-Valles et al. Nat Commun. .

Abstract

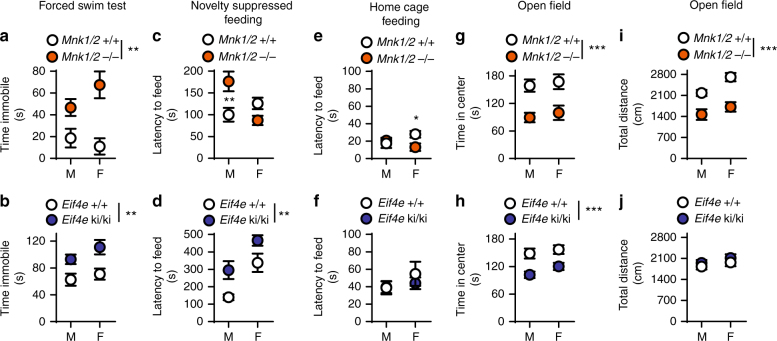
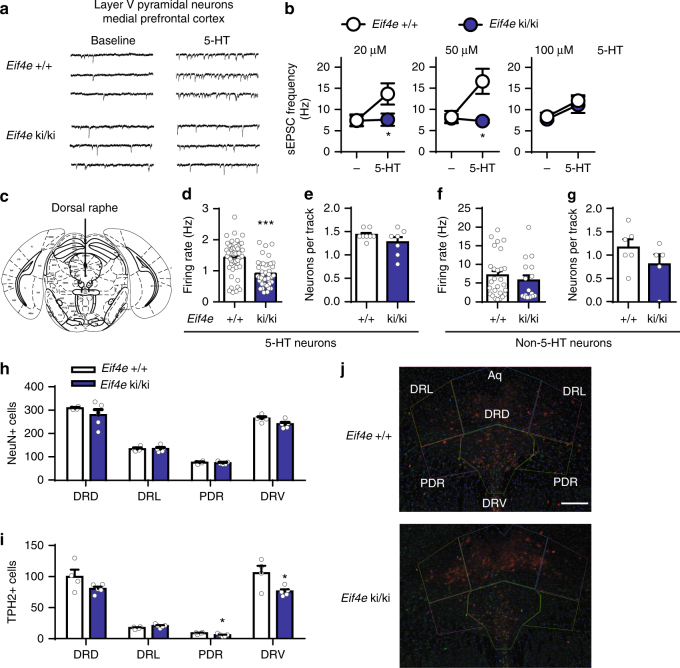
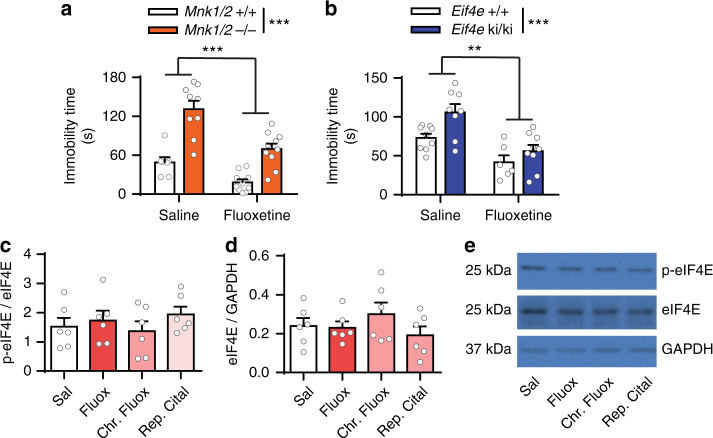
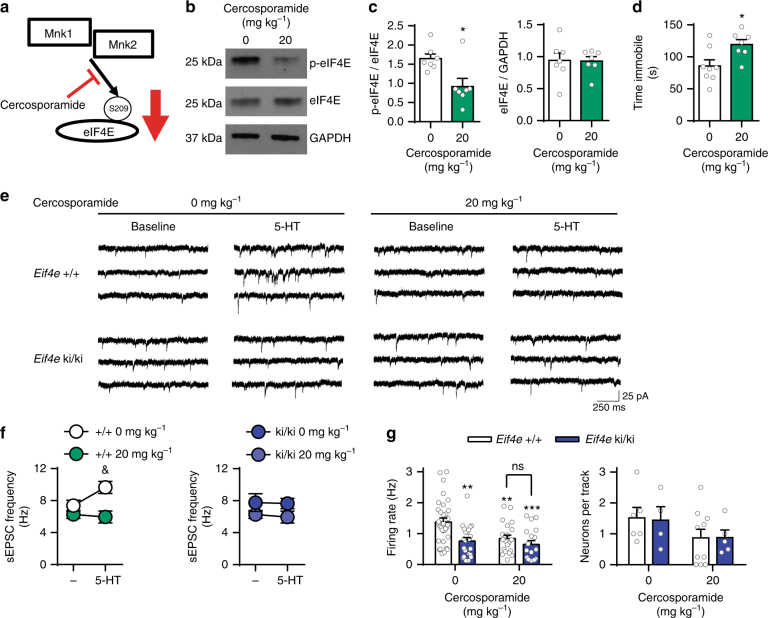
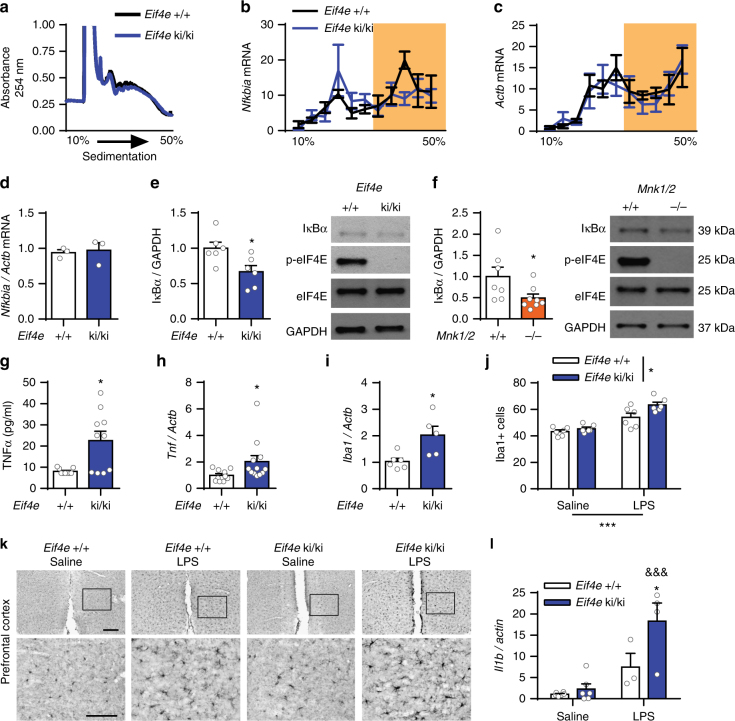
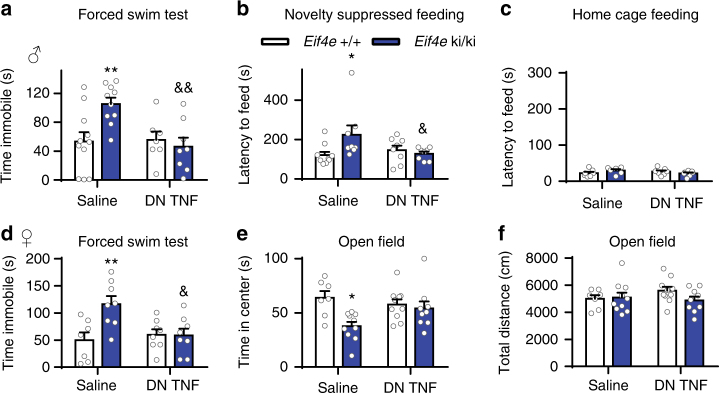
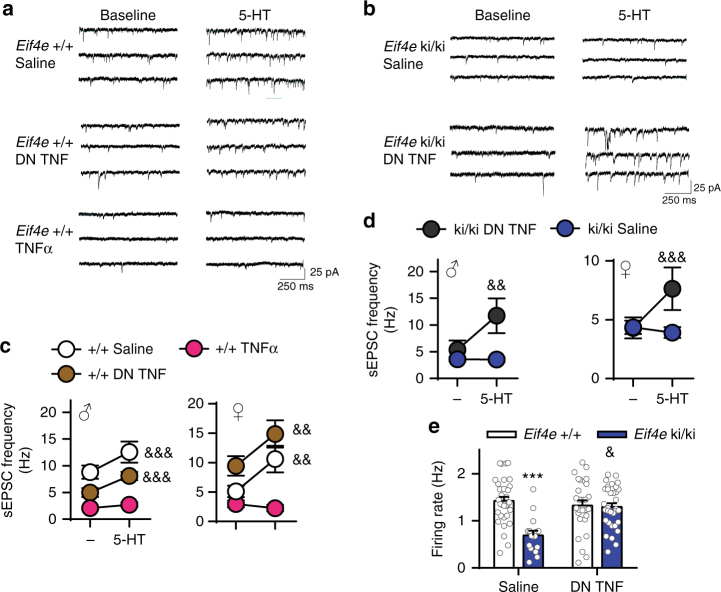
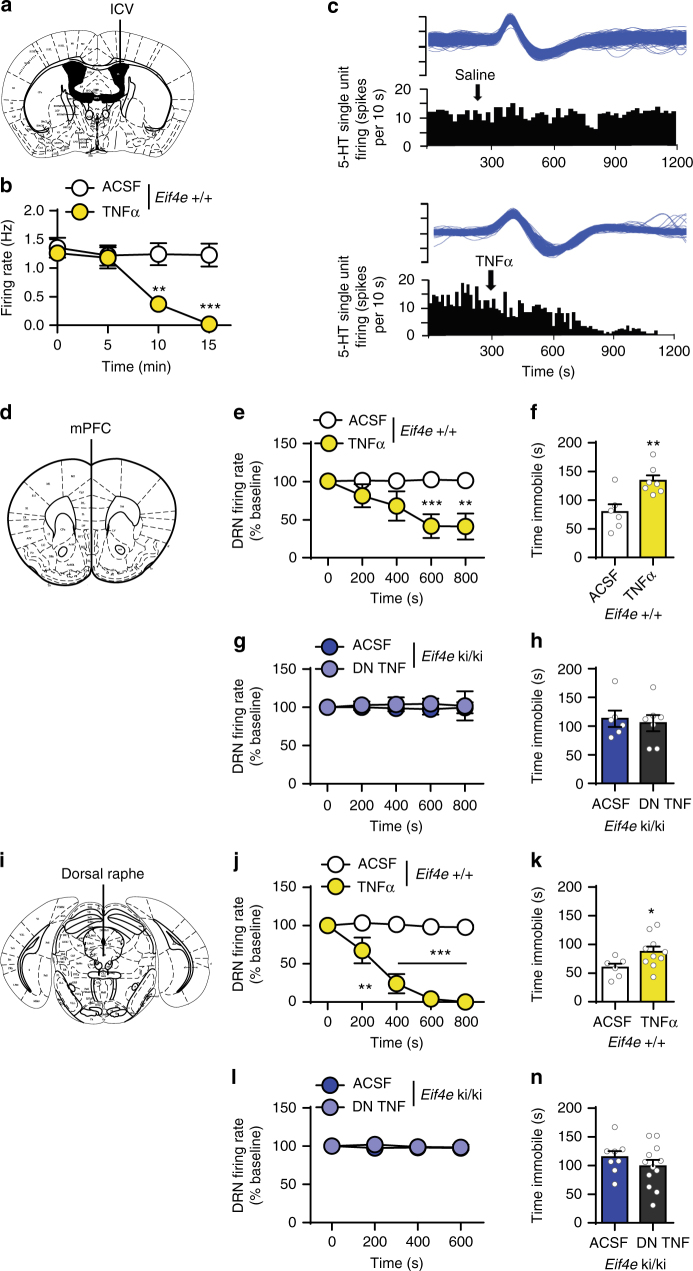
Translation of mRNA into protein has a fundamental role in neurodevelopment, plasticity, and memory formation; however, its contribution in the pathophysiology of depressive disorders is not fully understood. We investigated the involvement of MNK1/2 (MAPK-interacting serine/threonine-protein kinase 1 and 2) and their target, eIF4E (eukaryotic initiation factor 4E), in depression-like behavior in mice. Mice carrying a mutation in eIF4E for the MNK1/2 phosphorylation site (Ser209Ala, Eif4e ki/ki), the Mnk1/2 double knockout mice (Mnk1/2-/-), or mice treated with the MNK1/2 inhibitor, cercosporamide, displayed anxiety- and depression-like behaviors, impaired serotonin-induced excitatory synaptic activity in the prefrontal cortex, and diminished firing of the dorsal raphe neurons. In Eif4e ki/ki mice, brain IκBα, was decreased, while the NF-κB target, TNFα was elevated. TNFα inhibition in Eif4e ki/ki mice rescued, whereas TNFα administration to wild-type mice mimicked the depression-like behaviors and 5-HT synaptic deficits. We conclude that eIF4E phosphorylation modulates depression-like behavior through regulation of inflammatory responses.


Conflict of interest statement

The authors declare no competing interests.

Figures

Fig. 1
Fig. 1
Genetic inhibition of eIF4E phosphorylation induced anxiety- and depression-like behaviors. a Male (M) and female (F) mice mutant for the genes encoding MNK1 and MNK2 (Mnk1/2−/− mice) and their wild-type littermates (Mnk1/2+/+) were assessed for despair-like behavior in the forced swim test (FST) (M, n = 8 Mnk1/2+/+, n = 9 Mnk1/2−/−; F, n = 3 Mnk1/2+/+, n = 9 Mnk1/2−/−). b Male and female mice bearing a mutation in the Eif4e gene (Ser209 was substituted to Ala, Eif4e ki/ki) were also tested in the FST (M, n = 19 Eif4e+/+, n = 19 Eif4e ki/ki; F, n = 7 Eif4e+/+, n = 8 Eif4e ki/ki). c Novelty suppressed feeding (NSF) was assessed in Mnk1/2−/− (M, n = 9; F, n = 10) and wild-type mice (M, n = 8; F, n = 10). d NSF was also assayed in Eif4e+/+ and ki/ki mice (M, n = 9 Eif4e+/+, n = 9 Eif4e ki/ki; F, n = 8 Eif4e+/+, n = 9 Eif4e ki/ki). e Latency to feed in the home cage (home cage feeding, HCF) was determined in the Mnk1/2−/− and f Eif4e ki/ki mice and their littermates. g Time spent in the center of an open field (OF) arena was measured in Mnk1/2−/− (M, n = 12 Mnk1/2+/+, n = 8 Mnk1/2−/−; F, n = 7 Mnk1/2+/+, n = 13 Mnk1/2−/−) and h Eif4e ki/ki mice and their littermates (M, n = 17 Eif4e+/+, n = 18 Eif4e ki/ki; F, n = 11 Eif4e+/+, n = 19 Eif4e ki/ki). i Locomotion was also measured in Mnk1/2−/− and j Eif4e ki/ki mice. ** p < 0.01, *** p < 0.001 vs. wild-type littermates (see Supplementary Table 2 for detailed results of statistical tests)
Fig. 2
Fig. 2
Serotonergic dysfunction in Eif4e ki/ki mice. a Representative whole cell recordings of spontaneous excitatory post-synaptic currents (sEPSCs) from layer V pyramidal neurons of the medial prefrontal cortex (mPFC) of wild-type and Eif4e ki/ki mice. Traces represent consecutive recordings of synaptic currents before (baseline) and after 5-HT (20 μM) treatment from single pyramidal cells in each group. b Frequency of sEPSCs from pyramidal neurons of wild-type and Eif4e ki/ki mice before (−) and after 5-HT at 20 μM (n = 7 cells from 5 Eif4e+/+; n = 8 cells from 7 Eif4e ki/ki), 50 μM (n = 4 cells from 3 Eif4e+/+; n = 5 cells from 3 Eif4e ki/ki) or 100 μM (n = 5 cells from 3 Eif4e+/+; n = 6 cells from 3 Eif4e ki/ki). c In vivo single-unit extracellular recordings of dorsal raphe neurons were performed in anesthetized Eif4e+/+and ki/ki mice. d Firing rate of dorsal raphe 5-HT neurons, measured in Eif4e+/+and ki/ki mice (n = 56 single unit recordings from 8 Eif4e+/+mice; n = 43 single unit recordings from 7 Eif4e ki/ki mice). e 5-HT neurons recorded per descent (track) in the dorsal raphe of wild-type and Eif4e ki/ki mice (n = 8 Eif4e+/+mice; n = 7 Eif4e ki/ki mice). f Firing rate of non-5-HT neurons in the DR (n = 27 single unit recordings from 6 Eif4e+/+mice; n = 16 single unit recordings from 5 Eif4e ki/ki mice). g Number of non-5-HT neurons per descent in the DR (n = 6 Eif4e+/+mice; n = 5 Eif4e ki/ki mice). h Number of NeuN + cells in the DR nuclei, which was subdivided into DR dorsal part (DRD), DR lateral part (DRL), posterodorsal raphe nucleus (PRN), and DR ventral part (DRV). Data are means of 4 slides per animal (n = 4 Eif4e+/+mice; n = 5 Eif4e ki/ki mice). i Number of tryptophan hydroxylase 2 (TPH2) positive cells in the DRN. j Representative images of the DR IHC; blue: nuclear DAPI staining; red: TPH2; green: NeuN. Scale bar is 100 μM. * p < 0.05, *** p < 0.001 vs. wild-type littermates (see Supplementary Table 2 for detailed results of statistical tests)
Fig. 3
Fig. 3
Normal response to Fluoxetine in Eif4e ki/ki mice. a Male wild-type and Mnk1/2−/− mice were treated with saline or fluoxetine (IP, 3 mg kg−1) and tested in the FST after 30 min (n = 7 Mnk1/2+/+Saline, n = 9 Mnk1/2−/− Saline; n = 10 Mnk1/2+/+Fluoxetine, n = 10 Mnk1/2−/− Fluoxetine). b Male Eif4e+/+ and ki/ki were also treated with saline or fluoxetine (IP, 3 mg kg−1) and performed the FST after 30 min (n = 9 Eif4e+/+Saline, n = 8 Eif4e ki/ki Saline; n = 6 Eif4e+/+Fluoxetine, n = 9 Eif4e ki/ki Fluoxetine). c eIF4E phosphorylation in the mPFC/HPC of male wild-type mice treated with saline, 1 dose of fluoxetine (0.5 h, IP, 3 mg kg−1), chronic fluoxetine (14 × , IP, 10 mg kg−1) or repeated citalopram (3 × , IP, 10 mg kg−1) (n = 6/group). d Total eIF4E levels in the same samples as in (d). e Representative western blots for mice treated with vehicle or SSRIs. ** p < 0.01, *** p < 0.001 vs wild-type (see Supplementary Table 2 for detailed results of statistical tests)
Fig. 4
Fig. 4
Pharmacological inhibition of MNK1/2 induces despair-like behavior and 5-HT synaptic impairments. a Cercosporamide, an MNK1 and MNK2 inhibitor, was administered for 5 consecutive days to wild-type mice (IP, 20 mg kg−1). b Representative western blot images for phosphorylated eIF4E (p-eIF4E), total eIF4E and GAPDH in the cortex-hippocampus of mice treated with vehicle or cercosporamide. c Average levels of p-eIF4E in vehicle and cercosporamide-treated wild-type mice (vehicle (0 mg kg−1), n = 7; cercosporamide, n = 7). d Cercosporamide administration induced increased immobility in the Forced Swim Test (FST) in wild-type mice (vehicle (0 mg kg−1), n = 8; cercosporamide, n = 7). e Representative sEPSC traces from recordings in layer V mPFC from wild-type or Eif4e ki/ki mice treated with vehicle or cercosporamide. f Layer V mPFC sEPSC frequency of wild-type (left panel, vehicle n = 5 neurons from three mice, cercosporamide n = 6 neurons from two mice) or Eif4e ki/ki mice (right panel, vehicle n = 5 neurons from 2 mice, cercosporamide n = 7 neurons from 3 mice) treated with vehicle or cercosporamide. g Firing rate of 5-HT DR neurons in wild-type and Eif4e ki/ki mice treated with vehicle or cercosporamide (Eif4e+/+: Vehicle 33 neurons from 6 mice, cercosporamide 22 neurons from 10 mice; Eif4e ki/ki: vehicle 22 neurons from 4 mice, cercosporamide 18 neurons from 4 mice). * p < 0.05, ** p < 0.01, ***p < 0.001 vs vehicle-treated wild-type mice; & p < 0.05 vs. saline-treated Eif4e+/+ (see Supplementary Table 2 for detailed results of statistical tests)
Fig. 5
Fig. 5
Translation of Nfkbia mRNA is reduced in Eif4e ki/ki mice. a Representative polysome profile of cortex-hippocampus from Eif4e+/+and ki/ki mice (1 mouse per genotype). b Distribution of the Nfkbia mRNA in the polysome fractions of wild-type and Eif4e ki/ki mice (n = 4 Eif4e+/+; n = 5 Eif4e ki/ki). c, Actb mRNA was measured in both mouse strains as a control. d Total mRNA levels of Nfkbia in the cortex-hippocampus of Eif4e+/+and ki/ki mice. e Average protein levels and representative western blot images of the Nfkbia mRNA product, IκBα, in the mPFC of Eif4e wild-type and ki/ki mice (n = 6/group). f Average protein levels and representative western blot images IκBα, in the mPFC of Mnk1/2+/+ and −/− mice (n = 7 Mnk1/2+/+; n = 8 Mnk1/2−/−). g Levels of the cytokine tumor necrosis factor α (TNFα) in the mPFC in wild-type and Eif4e ki/ki mice (n = 9 Eif4e+/+; n = 10 Eif4e ki/ki). h Total levels of Tnf mRNA in the mPFC in wild-type and Eif4e mutant mice (n = 10 Eif4e+/+; n = 12 Eif4e ki/ki). i mRNA levels of the microglial marker Iba1 (Aif1) in the mPFC in wild-type and Eif4e mutant mice (n = 6 Eif4e+/+; n = 5 Eif4e ki/ki). j Number of Iba1 positive cells (Iba1+) per 0.01 mm2 of mPFC from wild-type and Eif4e ki/ki mice 48 h after saline or LPS (IP, 2.5 mg kg−1) treatment (n = 3/group). k Representative images of the mPFC of wild-type or Eif4e ki/ki mice 48 h after saline or LPS treatment. l mRNA levels of Il1b in the mPFC of wild-type or Eif4e ki/ki mice 48 h after saline or LPS treatment (n = 6 Eif4e+/+Saline, n = 6 Eif4e ki/ki Saline, n = 3 Eif4e+/+LPS; n = 4 Eif4e ki/ki LPS). * p < 0.05, *** p < 0.001 vs. wild-type; &&& p < 0.001 vs. saline-treated Eif4e ki/ki (see Supplementary Table 2 for detailed results of statistical tests)
Fig. 6
Fig. 6
TNFα causes behavioral impairments in Eif4e ki/ki mice. a wild-type and Eif4e ki/ki mice were administered (ICV) a dominant negative mutant version of TNFα (DN TNF) or vehicle for 12 days (via an osmotic pump connected to a guide cannula). Male mice were then evaluated in the FST (n = 11 Eif4e+/+ Saline, n = 7 Eif4e+/+ DN TNF, n = 10 Eif4e ki/ki Saline, n = 8 Eif4e ki/ki DN TNF). b Mice were also tested in the novelty suppressed feeding task (n = 10 Eif4e+/+ Saline, n = 8 Eif4e+/+ DN TNF, n = 8 Eif4e ki/ki Saline, n = 8 Eif4e ki/ki DN TNF). c Latency to feed in their home cage was also measured. d Female mice also administered with vehicle or DN TNF (ICV) were evaluated in the FST (n = 7 Eif4e+/+ Saline, n = 8 Eif4e+/+ DN TNF, n = 8 Eif4e ki/ki Saline, n = 8 Eif4e ki/ki DN TNF). e Female mice exploratory behavior was also measured in the center of an open field (OF) (n = 7 Eif4e+/+ Saline, n = 10 Eif4e+/+ DN TNF, n = 10 Eif4e ki/ki Saline, n = 9 Eif4e ki/ki DN TNF). f Their locomotion in the OF was also measured. * p < 0.05, ** p < 0.01, *** p < 0.001 vs. wild-type saline; &, p < 0.05, && p < 0.01, &&& p < 0.001 vs. saline-treated Eif4e+/+or ki/ki (see Supplementary Table 2 for detailed results of statistical tests)
Fig. 7
Fig. 7
TNFα causes serotonergic impairments in Eif4e ki/ki mice. a Representative sEPSC traces from mPFC pyramidal neurons in brain slices of wild-type mice treated with vehicle (saline), DN TNF (200 ng ml−1) or mouse recombinant TNFα (10 ng ml1). Synaptic currents were recorded before (baseline) and after 5-HT (20 μM) administration. b Representative sEPSC traces from Eif4e ki/ki mice treated with either vehicle or DN TNF (200 ng ml−1), measured before and after 5-HT (20 μM) administration. c Frequency of sEPSCs in mPFC slices of male and female wild-type mice. Slices were directly treated with saline (M: n = 10 cells from 6 mice; F: n = 9 cells from 6 mice), DN TNF (200 ng ml−1; M: n = 8 cells from 5 mice; F: n = 7 cells from 4 mice) or mouse recombinant TNFα (10 ng ml−1; M: n = 9 cells from 6 mice; F: n = 6 cells from 5 mice), pre- and post-5-HT (20 μM) application. d Average sEPSC frequency in Eif4e ki/ki mice before and after 5-HT (20 μM) application; slices were treated with either saline (M: n = 11 cells from 6 mice; F: n = 9 cells from 7 mice) or DN TNF (200 ng ml−1; M: n = 8 cells from 6 mice; F: n = 9 cells from 7 mice). e, Firing rate of DR neurons in wild-type and Eif4e ki/ki mice chronically treated with DN TNF or saline (ICV, 12 days; n = 33 recordings from 6 Eif4e+/+ Saline mice; n = 31 recordings from 5 Eif4e+/+ DN TNF mice; n = 16 recordings from Eif4e ki/ki Saline mice; n = 33 recordings from 6 Eif4e ki/ki DN TNF mice). * p < 0.05, ** p < 0.01, *** p < 0.001 vs. wild-type saline; & p < 0.05, && p < 0.01, &&& p < 0.001 vs. saline-treated Eif4e+/+or ki/ki (see Supplementary Table 2 for detailed results of statistical tests)
Fig. 8
Fig. 8
Simultaneous inhibition of mPFC and DR by TNFα underlies despair-like behavior. a Acute recombinant mouse TNFα (ICV, 0.02 pg ml−1) into wild-type mice. b Firing rate of DR neurons in wild-type mice treated with either artificial cerebrospinal fluid (ACSF) (n = 4) or mouse recombinant TNFα (n = 6) averaged in 5 minute bins. c Representative integrated firing rate histograms (spikes per 10 s) showing traces of DR neurons in wild-type mice treated with either saline or mouse recombinant TNFα. d Acute treatment of TNFα (0.1 fg in 0.5 µl ACSF) into the mPFC of wild-type mice or DN TNF (100 pg in 0.5 μl ACSF) to Eif4e ki/ki mice. d Firing rate of DRN 5-HT neurons of wild-type mice treated with ACSF (n = 6) or TNFα (n = 6) into the mPFC. e Immobility time in the FST, 20 min after ACSF (n = 6) or TNFα (n = 7) into the mPFC of wild-type mice. f, Firing rate of DRN 5-HT neurons of Eif4e ki/ki mice treated with ACSF (n = 5) or DN TNF (n = 5) into the mPFC. g FST immobility time 20 min after ACSF (n = 6) or DN TNF (n = 7) into the mPFC of Eif4e ki/ki mice. h Similar treatments were performed into the DRN. i 5-HT DR neuron firing rate after ACSF (n = 7) or TNFα (n = 6) in wild-type mice. j Despair-like behavior in wild-type mice treated with ACSF (n = 6) or TNFα (n = 10). k DRN 5-HT neurons in Eif4e ki/ki treated with ACSF (n = 5) or DN TNF (n = 4). l FST immobility in Eif4e ki/ki treated with ACSF (n = 8) or DN TNF (n = 12). * p < 0.05, ** p < 0.01, *** p < 0.001 vs. wild-type ACSF (see Supplementary Table 2 for detailed results of statistical tests)

References

    1. Global Burden of Disease Study, C. Global, regional, and national incidence, prevalence, and years lived with disability for 301 acute and chronic diseases and injuries in 188 countries, 1990-2013: a systematic analysis for the Global Burden of Disease Study 2013. Lancet. 2015;386:743–800. doi: 10.1016/S0140-6736(15)60692-4. - DOI - PMC - PubMed
    1. Kessler RC, et al. Lifetime prevalence and age-of-onset distributions of DSM-IV disorders in the National Comorbidity Survey Replication. Arch. Gen. Psychiatry. 2005;62:593–602. doi: 10.1001/archpsyc.62.6.593. - DOI - PubMed
    1. Rush AJ, et al. Acute and longer-term outcomes in depressed outpatients requiring one or several treatment steps: a STAR*D report. Am. J. Psychiatry. 2006;163:1905–1917. doi: 10.1176/ajp.2006.163.11.1905. - DOI - PubMed
    1. Dwivedi Y, et al. Reduced activation and expression of ERK1/2 MAP kinase in the post-mortem brain of depressed suicide subjects. J. Neurochem. 2001;77:916–928. doi: 10.1046/j.1471-4159.2001.00300.x. - DOI - PubMed
    1. Garcia-Fuster MJ, et al. FADD adaptor and PEA-15/ERK1/2 partners in major depression and schizophrenia postmortem brains: basal contents and effects of psychotropic treatments. Neuroscience. 2014;277:541–551. doi: 10.1016/j.neuroscience.2014.07.027. - DOI - PubMed

Publication types

MeSH terms