. 2018 Jun 25;8(1):9602.
doi: 10.1038/s41598-018-27977-y.

Towards a gene regulatory network shaping the fins of the Princess cichlid

Affiliations

Towards a gene regulatory network shaping the fins of the Princess cichlid

Ehsan Pashay Ahi et al. Sci Rep. .

Abstract

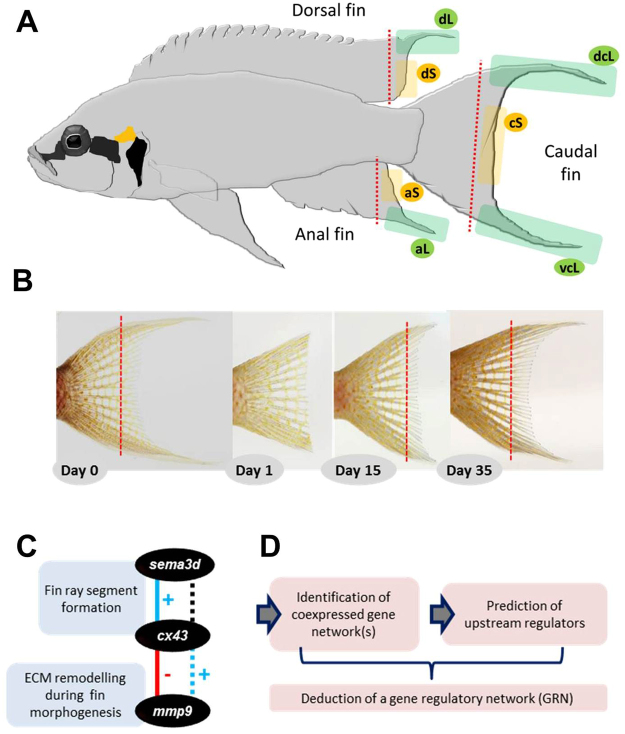
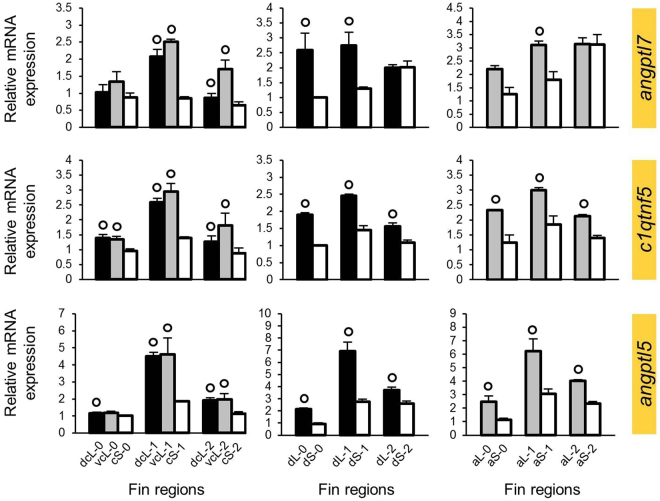
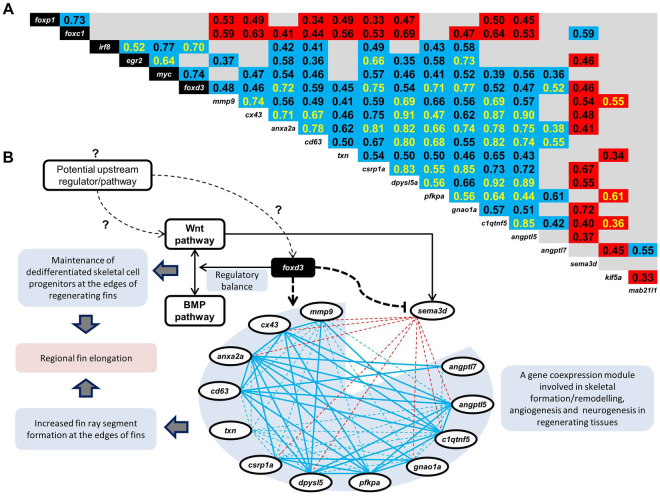
Variation in fin shape and size contributes to the outstanding morphological diversity of teleost fishes, but the regulation of fin growth has not yet been studied extensively outside the zebrafish model. A previous gene expression study addressing the ornamental elongations of unpaired fins in the African cichlid fish Neolamprologus brichardi identified three genes (cx43, mmp9 and sema3d) with strong and consistent expression differences between short and elongated fin regions. Remarkably, the expression patterns of these genes were not consistent with inferences on their regulatory interactions in zebrafish. Here, we identify a gene expression network (GRN) comprising cx43, mmp9, and possibly also sema3d by a stepwise approach of identifying co-expression modules and predicting their upstream regulators. Among the transcription factors (TFs) predicted as potential upstream regulators of 11 co-expressed genes, six TFs (foxc1, foxp1, foxd3, myc, egr2, irf8) showed expression patterns consistent with their cooperative transcriptional regulation of the gene network. Some of these TFs have already been implicated in teleost fish fin regeneration and formation. We particularly discuss the potential function of foxd3 as driver of the network and its role in the unexpected gene expression correlations observed in N. brichardi.


Conflict of interest statement

The authors declare no competing interests.

Figures

Figure 1
Figure 1
Fin dissections and a workflow for identifying gene regulatory network(s) underlying elongated fin phenotype in Neolamprologus brichardi. (A) An adult Lake Tanganyika cichlid fish, N. brichardi, displays filamentous elongations of the unpaired fins. Green shaded areas mark the elongated regions of the dorsal fin (dL), anal fin (aL), and the ventral and dorsal regions of the caudal fin (dcL and vcL); yellow shaded areas mark the short regions in the dorsal fin (dS), anal fin (aS), and in the center of the caudal fin (cS). The red dashed line represents the cutting line for the biopsy. (B) Tissue sampling at day 0 (first cut), day 15 (second cut) and day 35 (third cut) using the example of the caudal fin (photos by Wolfgang Gessl (www.pisces.at)). (C) Genes found to be associated with the elongated fin phenotype of N. brichardi, their function in zebrafish (blue squares) and their positive or negative expression correlation in zebrafish (continuous blue and red lines, respectively), as well as their contrasting expression correlation in N. brichardi (dashed lines; black colour indicates no expression correlation). (D) Schematic representation of the steps involved in the deduction of the gene regulatory network based on zebrafish co-expression data for sema3d, cx43 and mmp9.
Figure 2
Figure 2
Expression levels of candidate genes selected based on co-expression with mmp9. Means and standard deviations of RQ in three biological replicates are shown for the elongated (L) and short (S) regions of the caudal, dorsal and anal fin in original (stage 0) and regenerating tissue. See Fig. 1A for fin region codes; numbers 0 to 2 identify regeneration stages. Circles above bars indicate significantly elevated expression (P < 0.05 in paired t-tests) in comparisons between L and S tissue samples (i.e., compared to the bar matching the shade of the circle); note that the analysis was restricted to comparisons within the same fin type and the same regeneration stage. Genes highlighted in yellow and blue were identified in the first and second step of our gene selection procedure, respectively.
Figure 3
Figure 3
Expression levels of candidate genes selected based on co-expression with cx43. Means and standard deviations of RQ in three biological replicates are shown for the elongated (L) and short (S) regions of the caudal, dorsal and anal fin in original (stage 0) and regenerating tissue. See Fig. 1A for fin region codes; numbers 0 to 2 identify regeneration stages. Circles above bars indicate significantly elevated expression (P < 0.05 in paired t-tests) in comparisons between L and S tissue samples (i.e., compared to the bar matching the shade of the circle); note that the analysis was restricted to comparisons within the same fin type and the same regeneration stage. Genes highlighted in yellow and blue were identified in the first and second step of our gene selection procedure, respectively.
Figure 4
Figure 4
Expression levels of candidate genes selected based on co-expression with sema3d. Means and standard deviations of RQ in three biological replicates are shown for the elongated (L) and short (S) regions of the caudal, dorsal and anal fin in original (stage 0) and regenerating tissue. See Fig. 1A for fin region codes; numbers 0 to 2 identify regeneration stages. Circles above bars indicate significantly elevated expression (P < 0.05 in paired t-tests) in comparisons between L and S tissue samples (i.e., compared to the bar matching the shade of the circle); note that the analysis was restricted to comparisons within the same fin type and the same regeneration stage. Genes highlighted in yellow and blue were identified in the first and second step of our gene selection procedure, respectively.
Figure 5
Figure 5
Expression levels of predicted upstream regulators. Means and standard deviations of RQ in three biological replicates are shown for the elongated (L) and short (S) regions of the caudal, dorsal and anal fin in original (stage 0) and regenerating tissue. See Fig. 1A for fin region codes; numbers 0 to 2 identify regeneration stages. Circles above bars indicate significantly elevated expression (P < 0.05 in paired t-tests) in comparisons between L and S tissue samples (i.e., compared to the bar matching the shade of the circle); note that the analysis was restricted to comparisons within the same fin type and the same regeneration stage.
Figure 6
Figure 6
A proposed gene regulatory network underlying fin shape elongation in Neolamprologus brichardi. (A) Significant expression correlations between members of a gene network and their predicted upstream regulators across the unpaired fins of N. brichardi. Numbers indicate Pearson correlation coefficients (P < 0.01 in 2-tailed tests) based on gene expression data pooled across fins. Blue and red shadings represent positive and negative expression correlations, respectively. Yellow font indicates expression correlations, which were also significant in each of the three fins when analysed separately. (B) A proposed gene interaction model linking the identified genes and their functions, as well as their role in fin morphogenesis and regeneration in N. brichardi. In the co-expression module, positive (blue lines) and negative (red lines) expression correlations are indicated by solid lines, if the correlation was detected in each of the unpaired fins, while fin-specific correlations are indicated by dashed lines. Previously described regulatory connections are represented by black solid lines. Potential transcriptional induction and repression inferred in the present study is depicted by dashed black lines, and questionmarks indicate potential upstream regulatory connections which are not investigated in this study.

References

    1. Pfefferli C, Jaźwińska A. The art of fin regeneration in zebrafish. Regeneration. 2015;2:72–83. doi: 10.1002/reg2.33. - DOI - PMC - PubMed
    1. Nogueira AF, et al. Tetrapod limb and sarcopterygian fin regeneration share a core genetic programme. Nat. Commun. 2016;7:13364. doi: 10.1038/ncomms13364. - DOI - PMC - PubMed
    1. Nakamura T, Gehrke AR, Lemberg J, Szymaszek J, Shubin NH. Digits and fin rays share common developmental histories. Nature. 2016;537:225–228. doi: 10.1038/nature19322. - DOI - PMC - PubMed
    1. Nakatani Y, Kawakami A, Kudo A. Cellular and molecular processes of regeneration, with special emphasis on fish fins. Dev. Growth Differ. 2007;49:145–154. doi: 10.1111/j.1440-169X.2007.00917.x. - DOI - PubMed
    1. Marí-Beffa M, Murciano C. Dermoskeleton morphogenesis in zebrafish fins. Dev. Dyn. 2010;239:2779–2794. doi: 10.1002/dvdy.22444. - DOI - PMC - PubMed

Publication types

LinkOut - more resources