. 2018 Jun 25;9(1):2464.
doi: 10.1038/s41467-018-04815-3.

Mutually exclusive acetylation and ubiquitylation of the splicing factor SRSF5 control tumor growth

Affiliations

Mutually exclusive acetylation and ubiquitylation of the splicing factor SRSF5 control tumor growth

Yuhan Chen et al. Nat Commun. .

Abstract

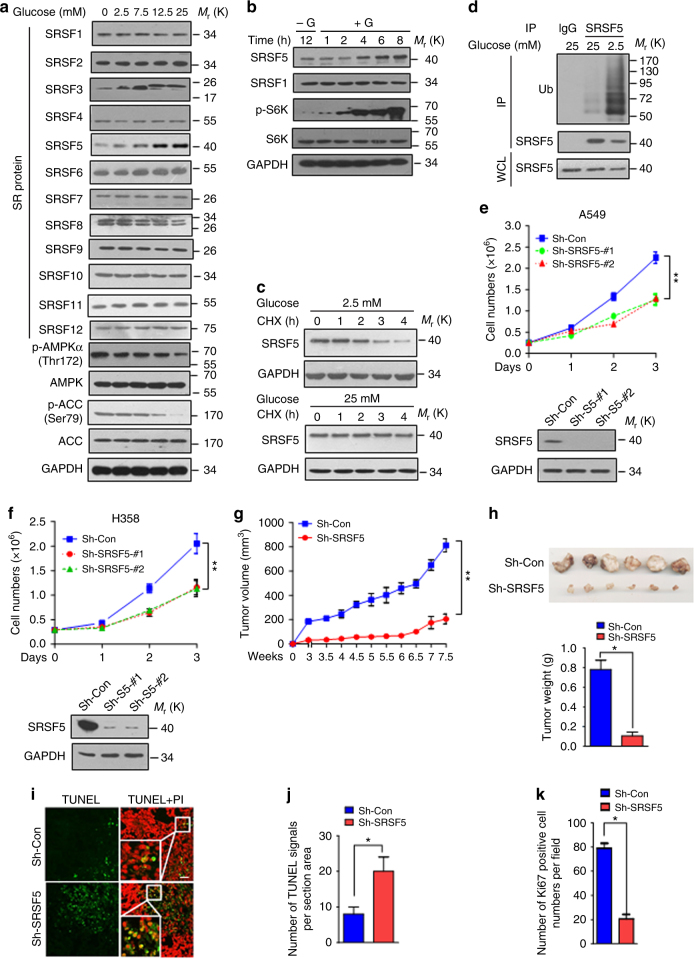
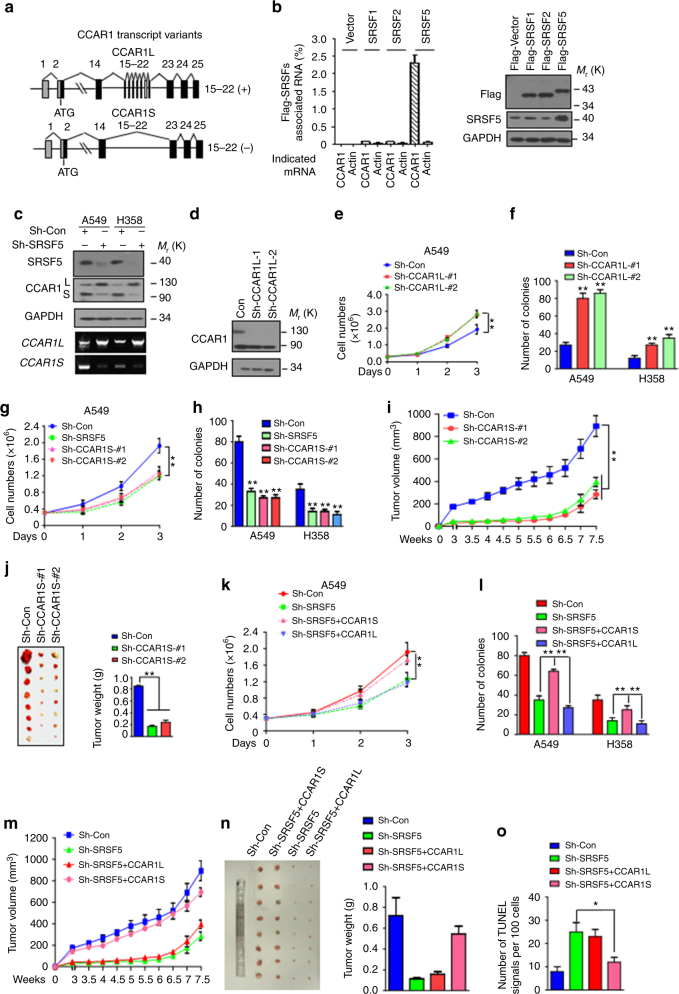
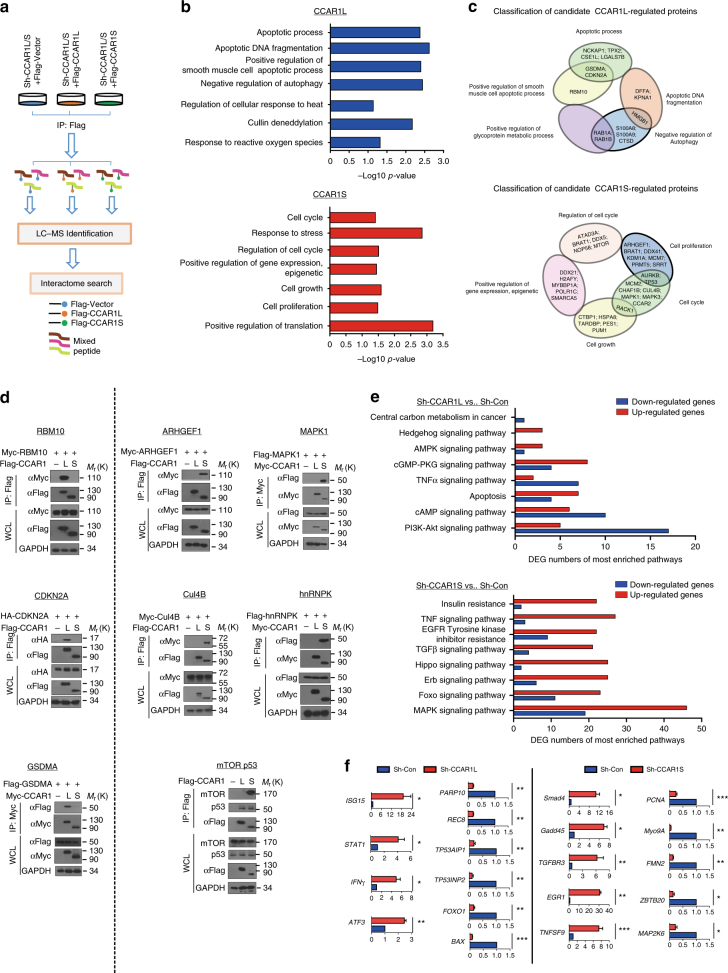
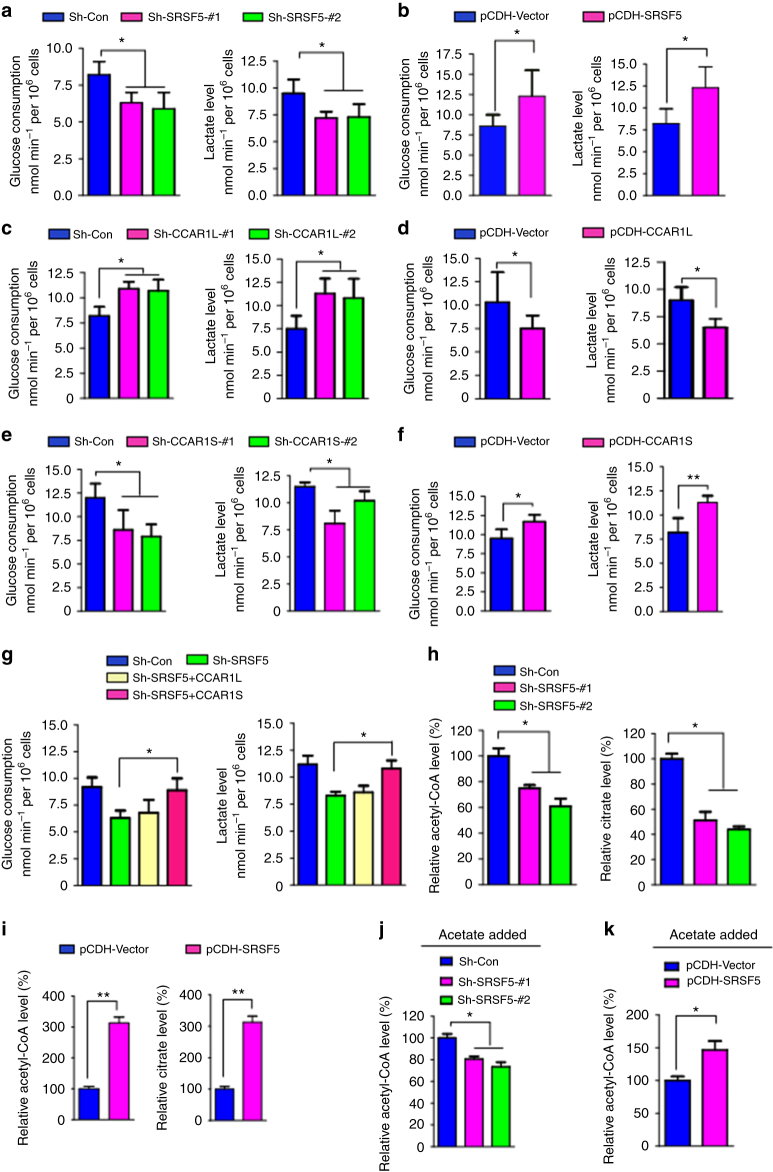
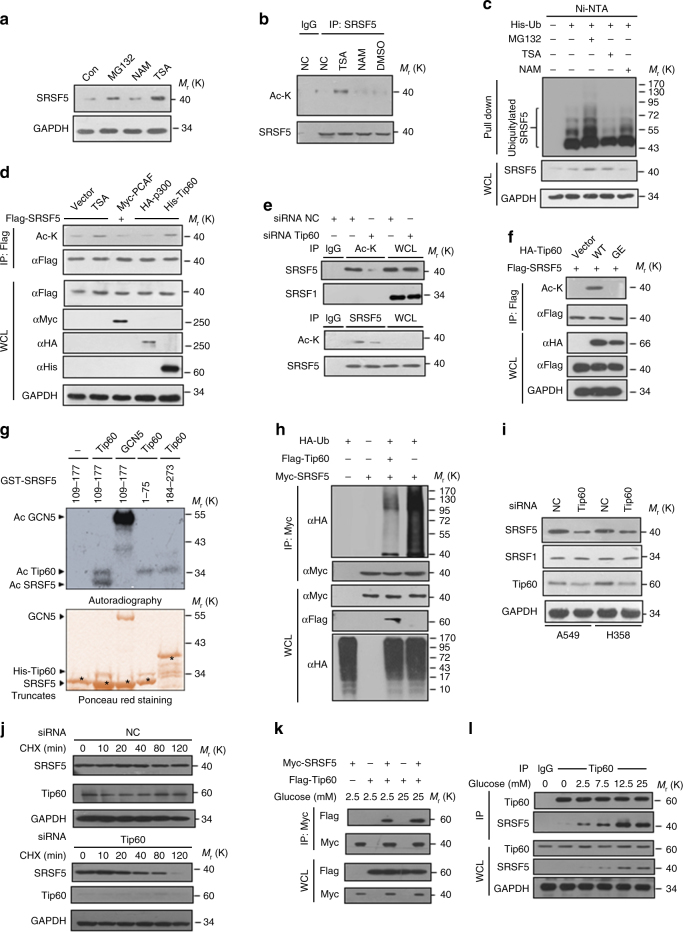
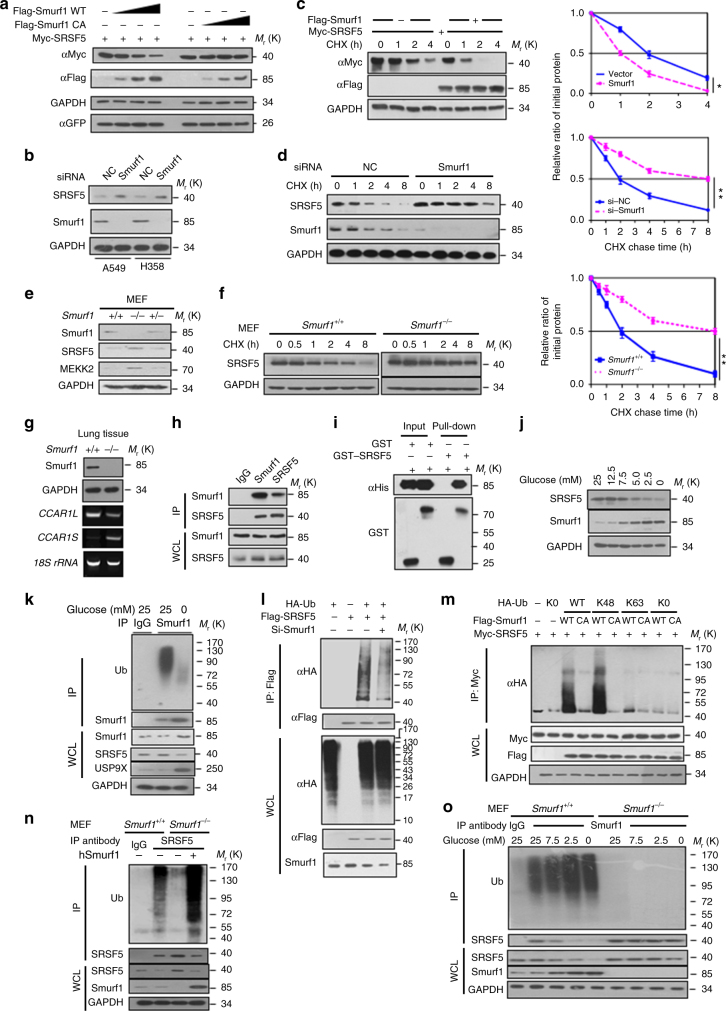
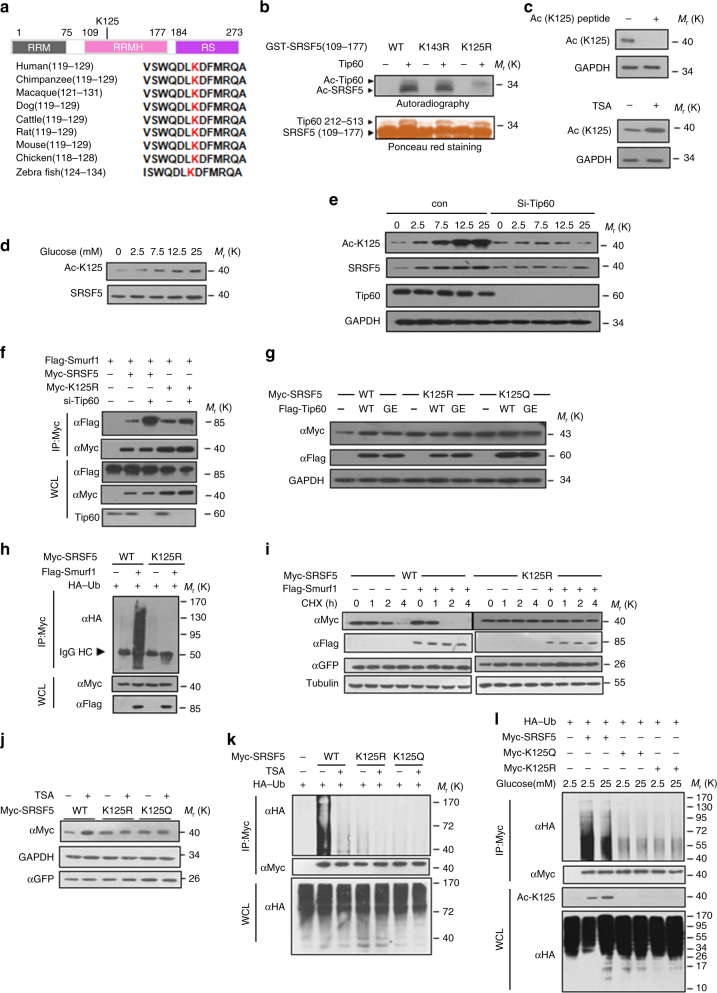
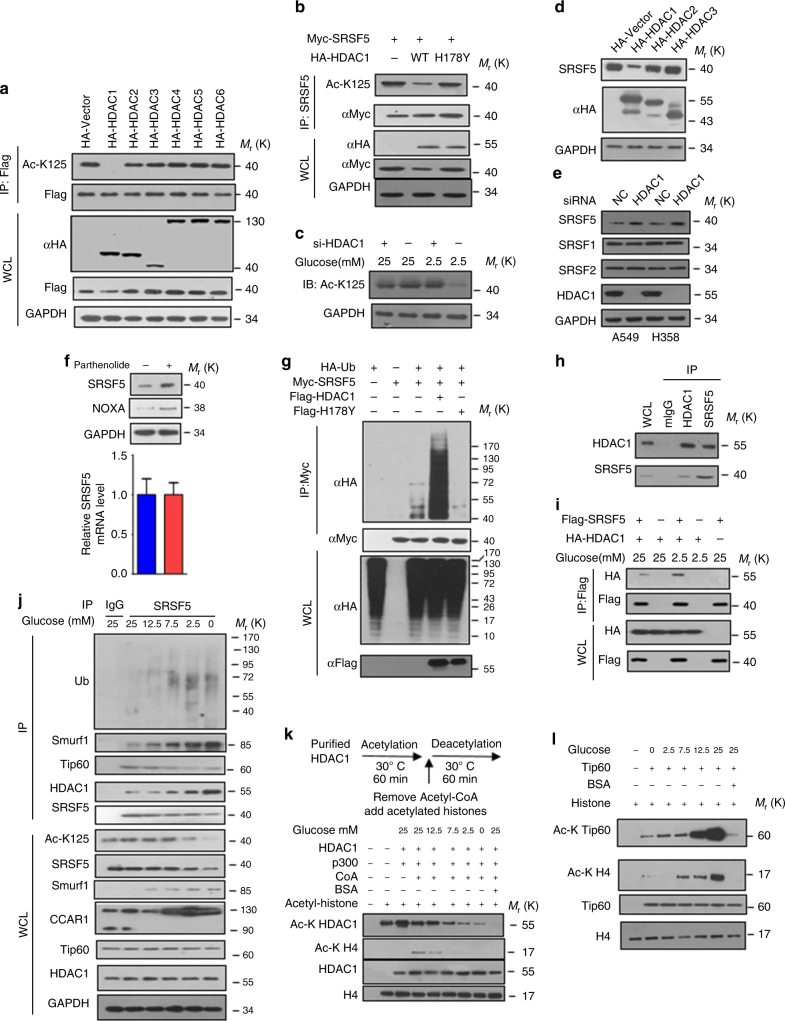
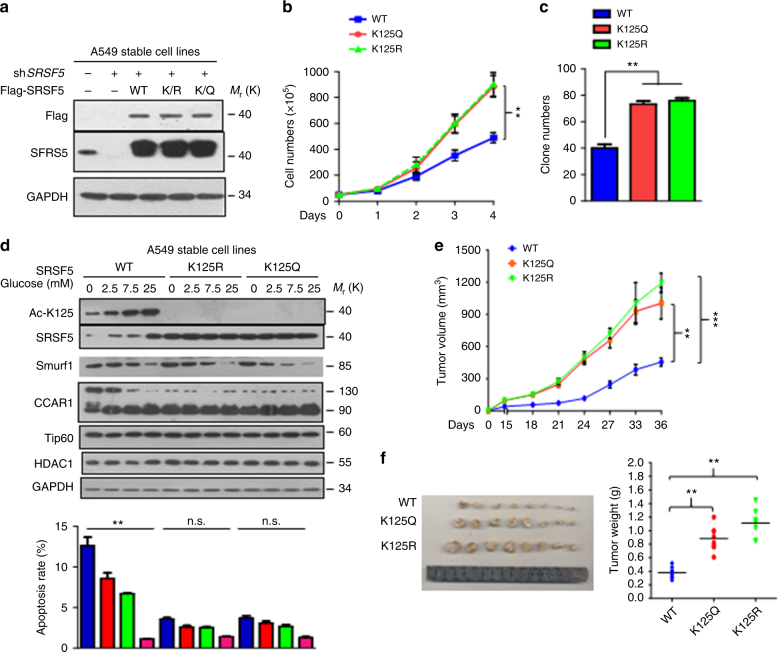
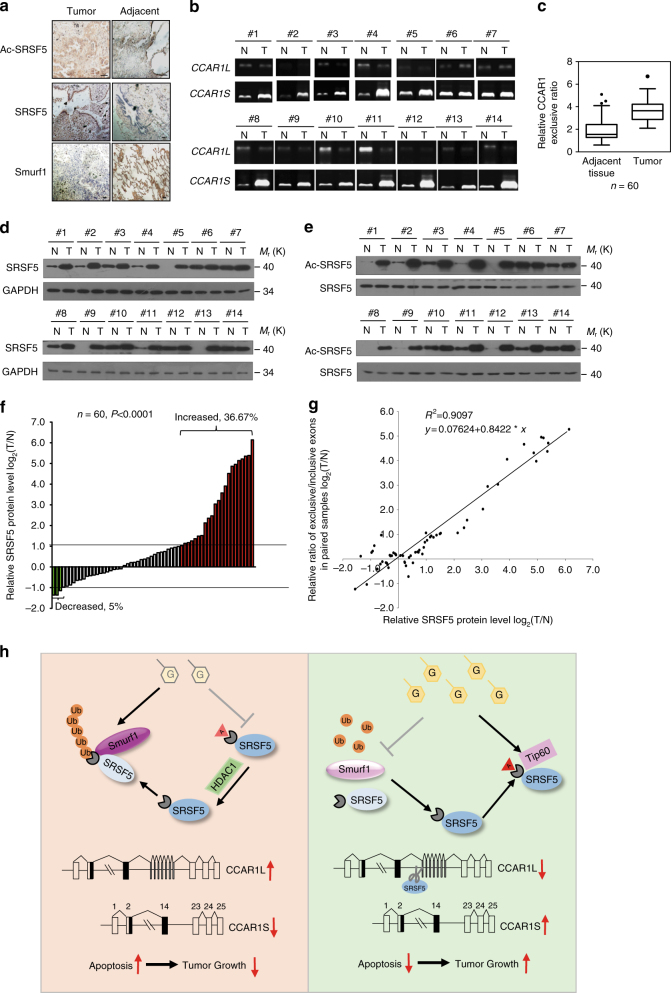
Most tumor cells take up more glucose than normal cells. Splicing dysregulation is one of the molecular hallmarks of cancer. However, the role of splicing factor in glucose metabolism and tumor development remains poorly defined. Here, we show that upon glucose intake, the splicing factor SRSF5 is specifically induced through Tip60-mediated acetylation on K125, which antagonizes Smurf1-mediated ubiquitylation. SRSF5 promotes the alternative splicing of CCAR1 to produce CCAR1S proteins, which promote tumor growth by enhancing glucose consumption and acetyl-CoA production. Conversely, upon glucose starvation, SRSF5 is deacetylated by HDAC1, and ubiquitylated by Smurf1 on the same lysine, resulting in proteasomal degradation of SRSF5. The CCAR1L proteins accumulate to promote apoptosis. Importantly, SRSF5 is hyperacetylated and upregulated in human lung cancers, which correlates with increased CCAR1S expression and tumor progression. Thus, SRSF5 responds to high glucose to promote cancer development, and SRSF5-CCAR1 axis may be valuable targets for cancer therapeutics.


Conflict of interest statement

The authors declare no competing interests.

Figures

Fig. 1
Fig. 1
SRSF5 is stabilized at high glucose to promote tumorigenesis. a A549 cells were cultured in medium containing glucose with indicated concentration for 18 h. Lysates were subjected to immunoblotting analysis with the SRSF antibodies. AMPK and ACC were analyzed as controls. b A549 cells were glucose-starved for 12 h and then stimulated with glucose (25 mM) for the indicated times. Cell lysates were subjected to immunoblotting. c A549 cells maintained in 25 or 2.5 mM glucose were treated with cycloheximide (10 μg/ml) for the indicated times. SRSF5 protein level was analyzed by immunoblotting. d A549 cells were maintained at indicated concentration of glucose. Cells were harvested for ubiquitylation analysis. A549 cells (e) and H358 cells (f) were transfected with shRNA-SRSF5 or random shRNA by a lentivirus system. Cell numbers were determined by a cell counter at indicated times (upper panel) and the expression level of SRSF5 was determined by immunoblotting (lower panel). (**P < 0.01, two-way ANOVA test). g Tumor growth curves in nude mice. The indicated stable cell lines were collected and subcutaneously injected into nude mice. Tumor diameters were measured twice a week and tumor volume were calculated. Each point represents the mean volume ± s.e.m., n = 6 mice per group (**P < 0.01, Mann–Whitney test). h Tumor weight. All the tumors derived from indicated cells were shown and tumor weight was measured. Results are shown as mean ± s.e.m. of tumor weights (n = 6, each with initial six injections) (**P < 0.01, Mann–Whitney test). i Tumors shown in h were formalin-fixed, paraffin-embedded, and sliced for TUNEL assay. Representative images of indicated TUNEL staining are shown. The boxed areas in the right images were magnified on the left. Scale bar, 50 μm. Quantification of positive signals of TUNEL (j) or Ki67 (k) from indicated groups based on n = 100 cells assessed from six fields in h were shown. (*P < 0.05, one-way ANOVA test). Data are representative of three independent biological replicates (e, f; mean and s.e.m., n = 3). Unprocessed original scans of blots are shown in Supplementary Fig. 9
Fig. 2
Fig. 2
SRSF5 controls CCAR1 splicing to regulate tumor cell growth. a Schematic diagram of CCAR1 splice variants. b In vivo ultraviolet cross-linking and immunoprecipitation (CLIP) from cells transfected with indicated plasmids were subjected to qPCR analysis with specific primers (left panel). Expression of each protein was confirmed by immunoblotting (right panel). c Depletion of SRSF5 leads to a shift of CCAR1 splicing module in A549 and H358 cells. d CCAR1L knockdown efficiency in A549 cells was assessed by immunoblotting analysis. e Cell proliferation assay of cells as in d (**P < 0.01, two-way ANOVA test). f Quantification of clonogenic formation assay of indicated cells. g Reduced proliferation in the absence of CCAR1S in A549 cells. Cell proliferation assay was performed as in e, cells stably expressing shRNA-SRSF5 was introduced for comparison. h Reduced clonogenic formation ability in the absence of CCAR1S in A549 and H358 cells. i CCAR1S depletion delays tumor growth in nude mice. Tumor diameters were measured at indicated time points to calculate tumor volume. Each point represents the mean volume ± s.e.m. (**P < 0.01, Mann–Whitney test). j CCAR1S depletion shrinks tumor growth in nude mice. All the tumors were shown (left) and measured (right). Results are shown as mean ± s.e.m. of tumor weights (**P < 0.01, Mann–Whitney test). k Cell proliferation assay were conducted in A549/sh-SRSF5 cells re-introduced with CCAR1L, CCAR1S, and control vectors. l Quantification of the number of colonies for A549 cells or H358 cells. m CCAR1S re-introduction in SRSF5-depleted cells enhanced tumor growth in nude mice. Data were collected and displayed as in i (*P < 0.05, Mann–Whitney test). n CCAR1S re-introduction in SRSF5-depleted cells displays enhanced tumor weight. Data were collected and displayed as in j (**P < 0.01, two-way ANOVA test). o Quantification of the TUNEL signals of tumor sections in n is shown. n = 100 cells from three fields were assessed (*P < 0.05, one-way ANOVA test). Data are representative of three independent biological replicates (eh, k, l; mean and s.e.m., n = 3). Unprocessed original scans of blots are shown in Supplementary Fig. 9
Fig. 3
Fig. 3
Network analysis of potential CCAR1L/S-associated proteins. a Experimental setup for the interactome analysis of the two CCAR1 isoforms (including CAR1L and CCAR1S). Equal amount of vector (control)-, CCAR1L-, or CCAR1S-overexpressing A549 cells were subjected to immunoprecipitation experiments using anti-Flag antibody followed by LC-MS/MS analysis. b Gene Ontology (GO) enrichment analysis for biological process, cell component, and molecular function of up-regulated proteins. The −log10 P value of enrichment is shown on x axis; the numbers represent the number of associated proteins for each term. c Classification of candidate CCAR1L and CCAR1S interacting proteins, which are thought to be specifically regulated by distinct isoforms. d IP-western validation of candidate CCAR1L (left) and CCAR1S (right) interacting proteins. CCAR1L, CCAR1S, and the indicated plasmids were transfected into A549 cells and co-immunoprecipitation assays were performed with the indicated antibodies followed by immunoblotting analysis. IP, immunoprecipitation; WCL, whole cell lysate. e KEGG analysis for differentially expressed genes (DEGs) among Sh-CCAR1L vs. Sh-Con, Sh-CCAR1S vs. Sh-Con groups. DEGs were identified following the criteria of log2ratio ≥ 1 and FDR ≤ 0.001. f Quantitative RT-PCR analysis of selected genes associated with enriched signaling pathways in CCAR1L- or CCAR1S-depleted A549 cells. Data are representative of three independent biological replicates. Unprocessed original scans of blots are shown in Supplementary Fig. 9
Fig. 4
Fig. 4
SRSF5 regulates glucose metabolism and acetyl-CoA production. a Analysis of glucose consumption rate and lactate production levels in SRSF5-depleted and control A549 cells. b Analysis of glucose consumption rate and lactate production levels in SRSF5-overexpressed and control A549 cells. c Analysis of glucose consumption rate and lactate production levels in CCAR1L-depleted and control A549 cells. d Analysis of glucose consumption rate and lactate production levels in CCAR1L-overexpressed cells. e Analysis of glucose consumption rate and lactate production levels in CCAR1S-depleted and control cells. f Analysis of glucose consumption rate and lactate production levels in CCAR1S-overexpressed cells. g Measurement of glucose consumption rate and lactate production levels in the cells described in Fig. 2k. h Acetyl-CoA levels and citrate levels in SRSF5-depleted and control A549 cells in high glucose. i Acetyl-CoA levels and citrate levels in SRSF5-overexpressed and control cells. j A549 cells depleted of SRSF5 were administrated to 5 mM acetate treatment and the relative acetyl-CoA level and citrate level were monitored. k A549 cells over-expressing SRSF5 were administrated to 5 mM acetate treatment and the relative acetyl-CoA level and citrate level were monitored. Data are representative of three independent biological replicates. All data are mean and s.e.m., n = 3. *P < 0.05 and **P < 0.01 (one-way ANOVA test)
Fig. 5
Fig. 5
Tip60 acetylates SRSF5 under high glucose. a TSA, but not NAM, increases SRSF5 protein level. A549 cells were treated with or without NAM and TSA. Protein level of SRSF5 was measured by immunoblotting and MG132 treatment was used as a positive control. b Endogenous SRSF5 is acetylated. Endogenous SRSF5 protein was purified from HEK293T cells after NAM and TSA treatment as indicated. Acetylation levels were analyzed by immunoblotting. c In vivo competition between ubiquitylation and acetylation of SRSF5 were revealed by Ni2+ pull-down assay. d Overexpression of Tip60, but not other typical members of acetyltransferases, increases endogenous SRSF5 acetylation at K125. e Tip60 knockdown sharply reduced SRSF5 acetylation level. f Acetyltransferase-activity of Tip60 is required for SRSF5 K125 acetylation. Flag-tagged SRSF5 was co-transfected with HA-tagged Tip60 WT or catalytically inactive mutant G380E into HEK293T cells. Acetylation was determined by immunoblotting. g Purified GST–SRSF5 fusion proteins were incubated with recombinant His-tagged Tip60212–513 or hGCN5 in the presence of [14C] acetyl-CoA. Acetylation was revealed after autoradiography (upper panel). Equivalent amounts of various recombinant proteins were assessed by Ponceau red staining (lower panel). h Overexpression of Tip60 decreases SRSF5 ubiquitylation. Flag-tagged Tip60 was co-transfected with Myc-tagged SRSF5 and HA-tagged ubiquitin. The ubiquitylation of SRSF5 was determined by IP-Western with anti-HA antibody. i Depletion of Tip60 decreases SRSF5 protein level in A549 and H358 cells. j Tip60 knockdown decreases SRSF5 protein stability. A549 cells were transfected with siTip60 or control were treated with CHX as previously described. The endogenous SRSF5 protein was determined and quantified by immunoblotting against GAPDH. k A549 cells were transfected with Myc-SRSF5 and Flag-Tip60 as indicated and the cells were treated with glucose of either 2.5 or 25 mM. Co-immunoprecipitation assays were performed to indicate the interaction between Tip60 and SRSF5. l Low glucose decreases the physiological interaction between SRSF5 and Tip60. A549 cells were treated with glucose of indicated concentrations and co-immunoprecipitation assays were performed to determine the dynamic interactions of Tip60 and SRSF5. Data are representative of three independent biological replicates. Unprocessed original scans of blots are shown in Supplementary Fig. 9
Fig. 6
Fig. 6
Smurf1 targets SRSF5 for degradation upon low glucose intake. a Smurf1 negatively regulates SRSF5 protein level in a dose-dependent manner. HEK293T cells were transfected with increasing amounts of Flag–Smurf1 WT and or Flag–Smurf1 CA vectors along with Myc-SRSF5 vectors for immunoblotting analysis. b Smurf1 knockdown increases the expression level of SRSF5 in A549 and H358 cells. c HEK293T cells transfected with the indicated plasmids were treated with CHX and harvested at the indicated times for western blot. d A549 cells transfected with siSmurf1 or control as previously described were treated with CHX for the indicated time to determine endogenous SRSF5 expression levels. e Expression analysis of endogenous SRSF5 protein in Smurf1+/+, Smurf1+/−, and Smurf1−/− MEFs were revealed by immunoblotting. f Half-life analysis of SRSF5 in Smurf1+/+ and Smurf1−/− MEFs. g Expression levels of CCAR1 splice variants were examined in the lung tissues of Smurf1+/+ and Smurf1−/− mice by RT-PCR. h Co-immunoprecipitation assay revealed that endogenous SRSF5 interacts with Smurf1 in A549 cells. i GST pull-down assays were performed to indicate the direct interaction between Smurf1 and SRSF5. j The expression level of Smurf1 reversely correlates with SRSF5 when glucose concentration declines. k Glucose deprivation dampens endogenous Smurf1 ubiquitylation. A549 cells were maintained in medium with or without 25 mM glucose. The endogenous Smurf1 ubiquitylation level were determined by IP-western. l Knockdown of Smurf1 decreases SRSF5 ubiquitylation. HEK293T cells with or without siSmurf1 were transfected with indicated plasmids. The ubiquitylation of SRSF5 was determined by IB analysis. m Smurf1 promotes the K48-linked poly-ubiquitylation of SRSF5 in vivo. The SRSF5 ubiquitylation linkage was analyzed in HEK293T cells transfected with indicated plasmids. n Ectopic expression of hSmurf1 by lentiviral infection rescues the ubiquitylation of endogenous SRSF5 in Smurf1−/− MEFs. o Smurf1 ubiquitylates SRSF5 by sensing glucose concentration. Smurf1+/+ and Smurf1−/− MEFs were maintained under various glucose concentrations and ubiquitylated SRSF5 was visualized. Blots are representative of three independent biological replicates. Error bars in c, d, f show s.e.m. from three independent experiments (**P < 0.01, two-way ANOVA test). Unprocessed original scans of blots are shown in Supplementary Fig. 9
Fig. 7
Fig. 7
Acetylation of SRSF5 protects it from degradation. a Multiple sequences alignments of SRSF5 across species. b K125 is a prime-candidate site for Tip60-mediated acetylation as detected by autoradiography. c Confirmation of Ac-K125 antibody activity. d Glucose increases SRSF5 K125 acetylation level. The loading was normalized to SRSF5 protein levels so as to indicate the relative acetylation level. e Tip60 is required for glucose-regulated SRSF5 acetylation. Endogenous basic and acetylated level of SRSF5 in control and Tip60 knockdown cells in response to different glucose concentration were detected by immunoblotting. f Inhibition of Tip60 increases the interaction between Smurf1 and wild-type SRSF5, but not K125R. HEK293T cells treated with or without Tip60 were transfected with indicated plasmids. The interaction between SRSF5 and Smurf1 was determined by IP-western. g Myc-tagged SRSF5 WT, K125R, K125Q plasmids were co-expressed for 36 h in A549 cells with either wild-type (WT) HA–Tip60 or mutant (G380E) HA–Tip60. Immunoblotting analysis using anti-Myc antibody is presented. h Amino acid K125 of SRSF5 is required for the ubiquitylation mediated by Smurf1 in vivo. HEK293T cells transfected with indicated plasmids were subjected to ubiquitylation analysis, as revealed by immunoblotting. i Substitution of SRSF5 lysine 125 to arginine prolongs its half-life. HEK293T cells were transfected with plasmids as indicated. Cells were subjected to CHX treatment for indicated times and the lysates were analyzed. j TSA treatment increases the abundance of SRSF5 WT but not K125 mutants. Myc-tagged SRSF5 K125 WT or mutant plasmids were transfected into HEK293T cells with or without TSA treatment. Expression of SRSF5 were analyzed by immunoblotting. k TSA decreases the ubiquitylation of SRSF5 WT, but not K125 mutants. HEK293T cells were transfected with indicated plasmids with or without TSA treatment. Ubiquitylation of purified proteins was analyzed. l High glucose decreases the ubiquitylation of SRSF5 WT, but not K125 mutants. HEK293T cells transfected with indicated plasmids were maintained under 2.5 or 25 mM glucose concentrations. Ubiquitylation and acetylation of purified proteins were analyzed. Data are representative of three independent biological replicates. Unprocessed original scans of blots are shown in Supplementary Fig. 9
Fig. 8
Fig. 8
HDAC1 deacetylates SRSF5 upon low glucose. a HDAC1 overexpression specifically decreases SRSF5 acetylation. HEK293T cells were transfected with indicated plasmids and the acetylation levels of SRSF5 were determined by immunoblotting. b Catalytic activity of HDAC1 is required for the deacetylation of SRSF5. Myc-tagged SRSF5 was co-transfected with HA-tagged HDAC1 WT or catalytically inactive mutant H178Y into HEK293T cells. Acetylation was determined by immunoblotting. c HDAC1 is required for glucose-regulated SRSF5 acetylation. HEK293T cells transfected with or without siHDAC1 were cultured in medium containing 2.5 or 25 mM glucose. d Overexpression of HDAC1 specifically decreases SRSF5 protein level as revealed by immunoblot. e HDAC1 knockdown increases SRSF5 protein level in A549 and H358 cells. f A549 cells were treated with or without HDAC1 inhibitor Parthenolide. Endogenous SRSF5 protein levels were determined by immunoblot analysis and relative SRSF5 mRNA levels were quantified by qPCR. g HDAC1, but not its catalytic-inactive mutant, promotes SRSF5 ubiquitylation. HEK293T cells transfected with Myc-tagged SRSF5, Flag-tagged HDAC1 WT or H178Y vectors, HA-tagged ubiquitin were subjected to ubiquitylation analysis, as revealed by immunoblotting. h Endogenous interaction between SRSF5 and HDAC1 were revealed by co-immunoprecipitation assays. i High glucose decreases the interaction between HDAC1 and SRSF5. Flag-tagged SRSF5 were co-transfected with HA-tagged HDAC1 into HEK293T cells upon different glucose concentrations. Protein interactions were determined. j A549 cells were maintained at various glucose concentrations for 18 h and harvested for immunoprecipitation and immunoblotting analysis. k HDAC1 activity is inhibited by acetylation at high concentration. HDAC1 purified from HEK293T cells maintained at different concentrations of glucose was first acetylated with p300. Acetyl-CoA was then removed by dialysis, and the samples were incubated with acetylated core histones to examine the HDAC1 deacetylase activity. l Glucose protrusion promoted Tip60 autoacetylation. Tip60 purified from A549 cells maintained at indicated glucose concentration was incubated with H4, [3H]-acetyl CoA, or BSA (1 mg) as indicated, and the auto-acetylation was detected by immunoblotting. Data are representative of three independent biological replicates (f; mean and s.e.m., n = 3). Unprocessed original scans of blots are shown in Supplementary Fig. 9
Fig. 9
Fig. 9
K125 mutants of SRSF5 promote tumor cell growth. a Verification of A549 stable cell lines. Knockdown efficiency and re-expression levels of wild-type or K125R/Q mutants were determined by immunoblotting. b K125R or K125Q A549 stable cell lines displayed higher proliferative rate than that of the WT cells. Cell numbers of indicated cell lines were counted every 24 h after seeding. Error bars represent cell numbers ± s.e.m. for triplicate experiments. The two-tailed Student’s t-test was used. **P < 0.01. c Quantification of the number of colonies for A549 cells as described in b. d The apoptosis ratio of A549 cells stably expressing WT, K125R, K125Q mutant subjected to various glucose concentration were determined (lower) and the indicated protein level of SRSF5, Smurf1, CCAR1 were determined by immunoblotting analysis (upper). (**P < 0.01, one-way ANOVA test). e, f K125R and K125Q mutants promote xenograft tumor growth. Subcutaneous xenograft experiment was performed in nude mice using A549 stable cells. Major and minor diameters of tumors were measured and tumor volumes were calculated. The two-tailed Student’s t-test was used. *P < 0.05; **P < 0.01; ***P < 0.001; NS denotes no significance (e). Thirty-six days after injection, tumors were dissected, photographed, and weighted. The two-tailed Student’s t-test was used. **P < 0.01; NS denotes no significance (f). Data are representative of three independent biological replicates (d; mean and s.e.m., n = 3). Unprocessed original scans of blots are shown in Supplementary Fig. 9
Fig. 10
Fig. 10
SRSF5 status correlates with CCAR1 splicing and tumorigenesis. a Representative images from immune-histochemical staining of Ac-SRSF5, SRSF5, and Smurf1 in three serial sections of the same tumor and matched adjacent tissue. Scale bar, 50 μm. b Total RNAs from 60 paired human NSCLC (T) and normal tissues (N) were examined by RT-PCR. Representative results for detection of CCAR1 exons 15–22 splicing patterns are shown. c Quantification of data from b for exons 15–22 exclusion ratio. The median box and whiskers plot was then calculated for the paired normal and tumor sets using Wilcoxon matched pairs test (*P < 0.05, one-way ANOVA test). d Lung cancer clinical cases with an increase in SRSF5 protein level. Human lung carcinoma samples paired with carcinoma tissue (shown as T) and adjacent normal tissue (shown as N) were lysed. The total SRSF5 protein levels were analyzed by immunoblotting analysis. e Lung cancer clinical cases with increased SRSF5 acetylation level at K125 in SRSF5-upregulated NSCLC. Human lung carcinoma samples paired with carcinoma tissue (shown as T) and adjacent normal tissue (shown as N) were lysed. The acetylated protein levels were compared against SRSF5 in immunoblotting analysis. f Relative expression of SRSF5 protein level in paired human clinical lung cancer samples and normal tissues. Immunoblotting analysis was performed on 60 paired human clinical lung cancer samples. Expression levels of SRSF5 were normalized to that of GAPDH. Data were calculated from triplicates. Bar value is the log ratio of SRSF5 expression levels between lung cancer samples (T) and matched normal tissues (N) from the same patient. Bar value ≤ −1 represents SRSF5 is decreased in tumors. Bar value > 1 represents that SRSF5 is increased in tumors. g Positive correlation between CCAR1 exclusive exons 15–22/inclusive exons 15–22 ratio and expression levels of SRSF5 was observed in human clinical lung samples. Relationships between these two variables were determined by Pearson’s correlation coefficients. h Model for ubiquitylation and acetylation of SRSF5 regulating alternative splicing of CCAR1 in signaling glucose sufficiency. Unprocessed original scans of blots are shown in Supplementary Fig. 9

Similar articles

Cited by

References

    1. Scotti MM, Swanson MS. RNA mis-splicing in disease. Nat. Rev. Genet. 2016;17:19–32. doi: 10.1038/nrg.2015.3. - DOI - PMC - PubMed
    1. Shepard PJ, Hertel KJ. The SR protein family. Genome Biol. 2009;10:242. doi: 10.1186/gb-2009-10-10-242. - DOI - PMC - PubMed
    1. Erkelenz S, et al. Position-dependent splicing activation and repression by SR and hnRNP proteins rely on common mechanisms. RNA. 2013;19:96–102. doi: 10.1261/rna.037044.112. - DOI - PMC - PubMed
    1. Long JC, Caceres JF. The SR protein family of splicing factors: master regulators of gene expression. Biochem. J. 2009;417:15–27. doi: 10.1042/BJ20081501. - DOI - PubMed
    1. Wang HY, Xu X, Ding JH, Bermingham JR, Jr, Fu XD. SC35 plays a role in T cell development and alternative splicing of CD45. Mol. Cell. 2001;7:331–342. doi: 10.1016/S1097-2765(01)00181-2. - DOI - PubMed

Publication types

MeSH terms