. 2018 Jul;24(7):1005-1014.
doi: 10.1038/s41591-018-0070-2. Epub 2018 Jun 25.

A human anti-IL-2 antibody that potentiates regulatory T cells by a structure-based mechanism

Affiliations

A human anti-IL-2 antibody that potentiates regulatory T cells by a structure-based mechanism

Eleonora Trotta et al. Nat Med. 2018 Jul.

Abstract

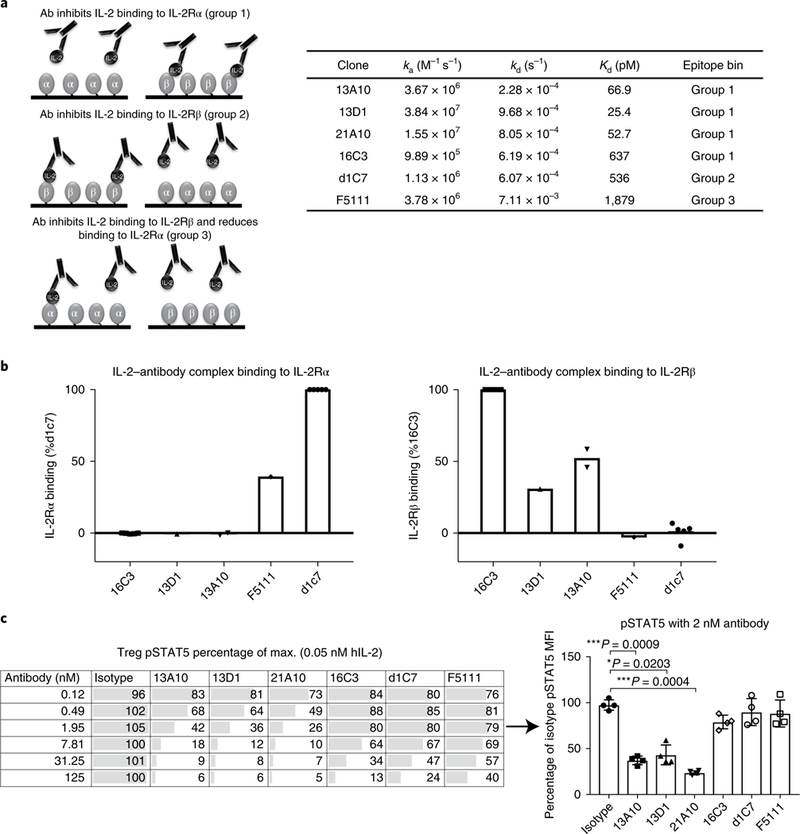
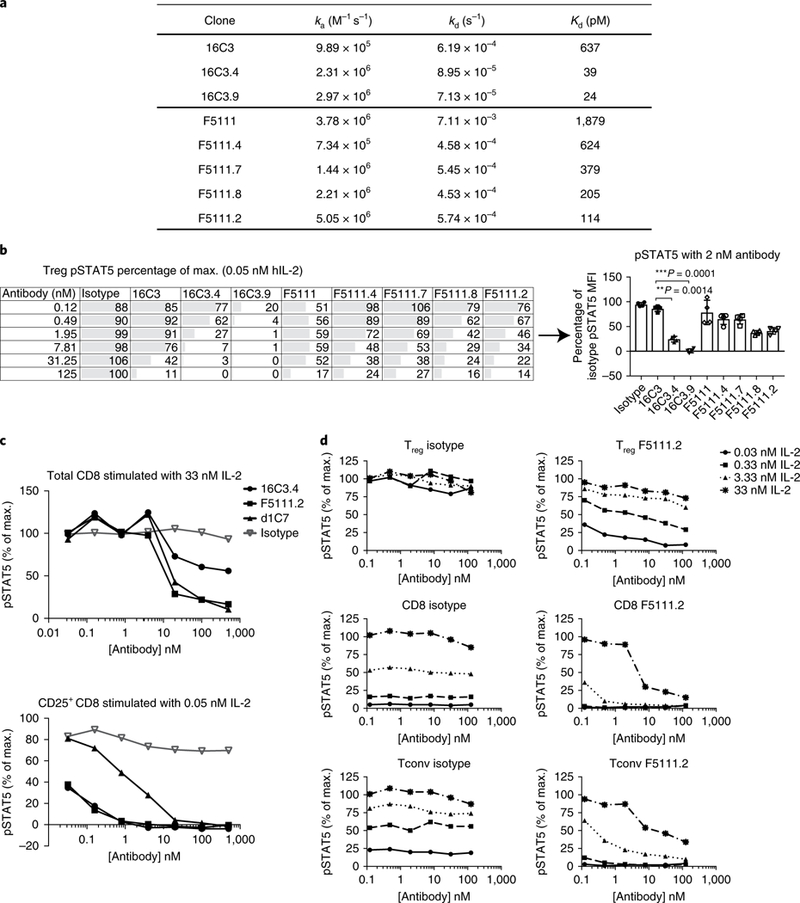
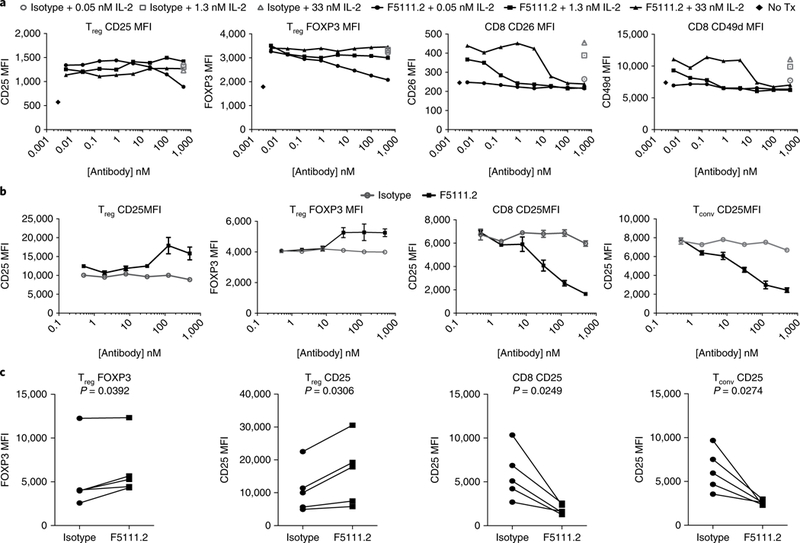
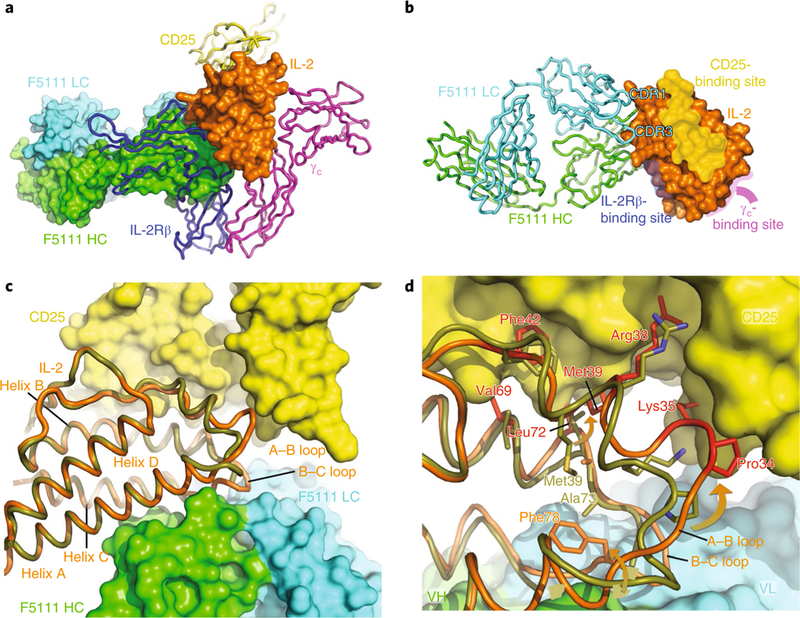
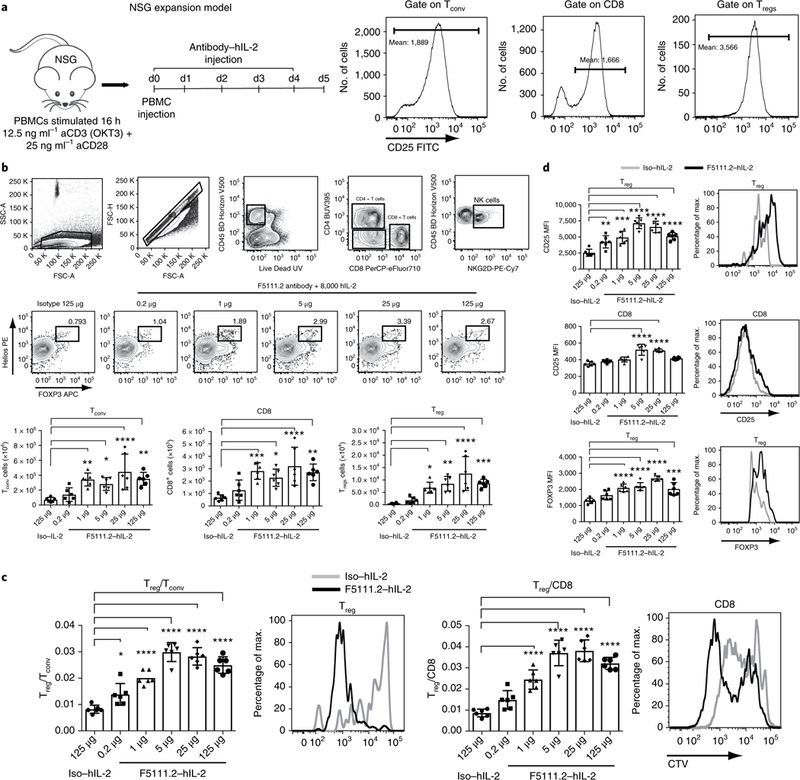
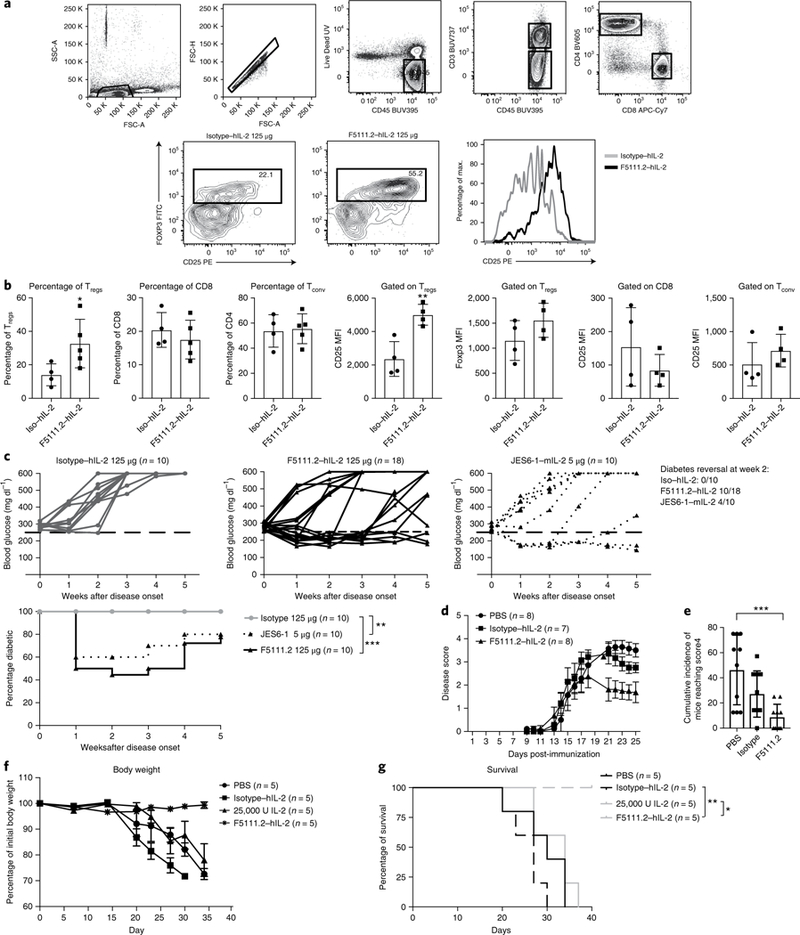
Interleukin-2 (IL-2) has been shown to suppress immune pathologies by preferentially expanding regulatory T cells (Tregs). However, this therapy has been limited by off-target complications due to pathogenic cell expansion. Recent efforts have been focused on developing a more selective IL-2. It is well documented that certain anti-mouse IL-2 antibodies induce conformational changes that result in selective targeting of Tregs. We report the generation of a fully human anti-IL-2 antibody, F5111.2, that stabilizes IL-2 in a conformation that results in the preferential STAT5 phosphorylation of Tregs in vitro and selective expansion of Tregs in vivo. When complexed with human IL-2, F5111.2 induced remission of type 1 diabetes in the NOD mouse model, reduced disease severity in a model of experimental autoimmune encephalomyelitis and protected mice against xenogeneic graft-versus-host disease. These results suggest that IL-2-F5111.2 may provide an immunotherapy to treat autoimmune diseases and graft-versus-host disease.


Figures

Fig 1 |
Fig 1 |. Characterization of human anti-IL-2 antibodies with different receptor inhibition and human Treg pSTAT5 signaling profiles.
a, Schematic of IL-2Rβ- and α-blocker anti-IL-2 antibodies, and SPR kinetic binding analysis of the antibody-IL-2 interactions. Antibodies were grouped into epitope bins on the basis of their ability to block binding of IL-2 to IL-2Rα (group 1) and IL-2Rβ (group 2), and partial inhibition of IL-2Rα/full inhibition of IL-2Rβ (group 3). b, SPR analysis of antibody-IL-2 complexes binding to the a (left) and p (right) subunits of the IL-2 receptor. The data are shown as a percentage of the control: 16C3 for IL-2Rβ binding and d1C7 for the IL-2Rα binding. c, STAT5 phosphorylation response of human Tregs to anti-hIL-2 antibodies belonging to epitope bin groups 1, 2 and 3. Serial dilutions of antibodies in complex with 0.05nM hIL-2 were used. Left, a single donor representative of four is shown (mean of duplicate wells). Right, responses from four donors are shown for a single antibody concentration (2nM antibody). Each symbol represents an individual donor, the bars indicate the mean and the error bars represent standard deviation. The P values shown were determined by one-way ANOVA (Dunnett’s multiple-comparison test compared with the isotype control).
Fig. 2 |
Fig. 2 |. Identification of a novel anti-human IL-2 antibody that inhibits effector T cell responses to IL-2 but does not block Treg pSTAT5.
a, Kinetic binding analysis of affinity-matured variants of 16C3 and F5111. b, Serial dilutions of anti-hIL-2 antibodies in complex with 0.05nM of hIL-2 were assessed on the basis of STAT5 phosphorylation responses of human Tregs to increasing affinities of 16C3 (Group 1) and F5111 (Group 3). A single donor, representative of four individuals, is shown on the left (mean of duplicate wells). Right, responses from the four donors are shown for a single antibody concentration (2 nM antibody). Each symbol represents an individual donor, the bars indicate the mean and the error bars represent standard deviation. The P values shown were determined by one-way ANOVA (Dunnett’s multiple-comparison test compared with the isotype control). c, STAT5 phosphorylation of total CD8 versus CD25+ CD8 cells in response to anti-hIL-2 antibodies from different epitopes bins. Serial dilutions of anti-hIL-2 antibodies in complex with two different concentrations of hIL-2 (0.05 nM and 33 nM) were used. Data are representative of four individual donors. d, STAT5 phosphorylation responses of human Tregs, CD8+ T cells and Tconv cells to serial dilutions of F5111.2 in complex with four different concentrations of hIL-2. Data are representative of two individual donors. A similar experiment, with three concentrations of IL-2 (33, 1.32 and 0.05 nM IL-2), was performed on ten individual donors, and results are comparable. For b and d, Tregs were identified by gating on CD3+CD4+CD25highCD127low cells.
Fig. 3 |
Fig. 3 |. Antibody F5111.2 inhibits upregulation of IL-2-induced proteins in CD8+ T cells but not Tregs in vitro.
a, IL-2-inducible protein expression on Tregs and CD8+ T cells with serial dilutions of F5111.2 in complex with three different concentrations of hIL-2 (0.05 nM, 1.3 nM and 33 nM) for 48 h. Isotype- matched antibody was used as a control. Representative results from one of four experiments are shown, with data presented as the mean of duplicates of cell culture wells. b, Dose response of CD25 and FoxP3 expression on Treg, Tconv and CD8 cells following expansion of human PBMCs in the presence of hIL-2 (5 ngml−1)-F5111.2 complexes for five days. Representative results from one of five experiments are shown. The symbol is plotted at the mean of triplicate wells, with the error bars representing standard deviation. c, CD25 and FoxP3 expression on Treg, Tconv and CD8 cells following TCR stimulation of human PBMCs in the presence of F5111.2-hIL-2 complex for five days. The amount of F5111.2 used was 125nM in complex with 5 ng ml−1 (0.33 nM) of hIL-2. Five different donors are represented. The P values shown were determined by a two-tailed paired Student’s t-test and 95% confidence intervals.
Fig. 4 |
Fig. 4 |. The IL-2-F5111 complex structure reveals that the F5111 Fab obstructs the IL-2Rβ-binding site on IL-2.
a, The IL-2-F5111 complex superimposed on the IL-2-receptor quaternary complex (PDB code 2B5I) shows steric obstruction of IL-2Rβ by the Fab. The F5111 heavy chain (HC; green) and light chain (LC; cyan) and IL-2 (orange) are shown in surface representation. CD25 (yellow), IL-2Rβ (blue) and γc (magenta) are shown as ribbons. b, IL-2 (surface representation) complexed with F5111 (ribbons) is shown, highlighting the binding sites on IL-2 for the IL-2 receptor complex. c, A ‘top-down’ view comparison of the IL-2 conformations in the IL-2-F5111 complex (orange) and the IL-2-receptor quaternary complex (PDB code 2B5I, olive-yellow) shows that the position of the IL-2 A-B loop in the IL-2-F5111 complex is incompatible with CD25 binding. IL-2 is shown as a ribbon while CD25 is shown in surface representation. d, High-resolution depiction of c. The IL-2 residues in the IL-2-F5111 complex that would conflict with CD25 are highlighted in red. The arrows illustrate movements of the A-B and B-C loops induced by F5111 binding. VH, heavy-chain variable domain; VL, light-chain variable domain.
Fig. 5 |
Fig. 5 |. The F5111.2-hIL-2 complex preferentially increases Tregs in an in vivo NSG expansion model.
a, NSG expansion model. Human PBMCs were activated with polyclonal stimulation overnight, and injected into 12-week-old NSG mice. The mice received five consecutive days of F5111.2-hIL-2 complex treatment. CD25 expression (MFI) on human Tconv, Tregs and CD8+ T cells before injection at day 0. b, Gating strategy, Treg percentage in response to different doses of F5111.2-hIL-2 complex; Tconv, CD8 and Treg total cell number. c, Treg/Tconv and Treg/CD8 ratio after treatment with different doses of F5111.2 (0.2, 1, 5, 25 and 125 μg) and the isotype (125μg) in complex with 8,000 U (~0.49μg) hIL-2. Representative histograms show CellTrace Violet (CTV) dilutions of Treg and CD8 in response to F5111.2-hIL-2 complex (black line) compared to the isotype control (gray line). d, CD25 and FoxP3 MFI on Tregs and CD8 in response to different doses of F5111.2-hIL-2 complex. Representative histograms show CD25 and FoxP3 MFI on Tregs and CD8 in response to the isotype (gray line) and the F5111.2-hIL-2 complex (black line). For a-d, the experiment was repeated three times with similar results. One of three similar experiments is shown, with data presented as the mean± s.d. of six mice per group. The P values shown were determined by one-way ANOVA (Dunnett’s multiple-comparison test). *P≤0.05, **P≤0.01, ***P≤ 0.001, ****P≤0.0001.
Fig. 6 |
Fig. 6 |. The F5111.2-hIL-2 complex increases the Treg proportion and reinforces the Treg phenotype in inflamed pancreas leading to diabetes remission in NOD mice.
a, The gating strategy and percentage of Tregs in the pancreas of new onset diabetic NOD mice treated with the isotype (125 μg) or F5111.2 (125 μg) in complex with 8,000 U hIL-2 for 5 consecutive days at disease onset. Tregs were identified gating on CD45+CD4+CD25+FoxP3+ cells. Representative histograms show CD25 expression on FoxP3+ Tregs in response to the isotype (gray line) or F5111.2-hIL-2 (black line) complex treatment. b, Bar graphs summarizing the percentage of Tregs, CD8 and Tconv and CD25 expression on Tregs, CD8 and Tconv. The data are presented as the mean±s.d. of four mice per group. The P values shown were determined by unpaired two-tailed f-test. c, Blood glucose concentrations of new onset diabetic NOD mice treated with the isotype (left), F5111.2-hIL-2 (center) and JES6–1-mIL-2 complex (right). The 250 mgdl−1 blood glucose value is indicated by a dashed black line. The age of treatment onset was 14± 24 weeks; percentage of diabetic mice plotted. The P values shown were determined by two-way ANOVA (Dunnett’s test). *P<0.05, **P<0.01, ***P< 0.001. d, Disease score of EAE in B6 mice treated with PBS, 25,000 IU IL-2 in complex with 50 μg of the isotype or 50 μg of F5111.2. e, Cumulative incidence of mice reaching clinical score 4. The data are representative of two independent experiments. The P values shown were determined by one-way ANOVA (Dunnett’s test). f, Recipient NSG mice were grafted with 30×106 activated PBMCs and treated with daily injections of PBS, 25,000 IU hIL-2, 25 μg of F5111.2 or the isotype in complex with 8,000 U hIL-2 for five consecutive days. g, Weight curves and Kaplan-Meier survival curves of the grafted mice. The data are presented as the mean± s.d. of five mice per group. The P values shown were determined by Mantel-Cox test. *P<0.05, **P<0.01, ***P<0.001.

Comment in

  • Tipping the Balance.
    Jaeckel E, Noyan F, Taubert R. Jaeckel E, et al. Transplantation. 2019 Jan;103(1):4-6. doi: 10.1097/TP.0000000000002506. Transplantation. 2019. PMID: 30586107 No abstract available.

References

    1. Morgan DA, Ruscetti FW & Gallo R Selective in vitro growth of T lymphocytes from normal human bone marrows. Science 193, 1007–1008 (1976). - PubMed
    1. Boyman O & Sprent J The role of interleukin-2 during homeostasis and activation of the immune system. Nat. Rev. Immunol. 12, 180–190 (2012). - PubMed
    1. Liao W, Lin J-X & Leonard WJ Interleukin-2 at the crossroads of effector responses, tolerance, and immunotherapy. Immunity 38, 13–25 (2013). - PMC - PubMed
    1. Malek TR & Castro I Interleukin-2 receptor signaling: at the interface between tolerance and immunity. Immunity 33, 153–165 (2010). - PMC - PubMed
    1. Sakaguchi S, Sakaguchi N, Asano M, Itoh M & Toda M Immunologic self-tolerance maintained by activated T cells expressing IL-2 receptor alpha-chains (CD25). Breakdown of a single mechanism of self-tolerance causes various autoimmune diseases. J. Immunol. 155, 1151–1164 (1995). - PubMed

MeSH terms