. 2018 Aug;24(8):1178-1191.
doi: 10.1038/s41591-018-0085-8. Epub 2018 Jun 25.

A natural killer-dendritic cell axis defines checkpoint therapy-responsive tumor microenvironments

Affiliations

A natural killer-dendritic cell axis defines checkpoint therapy-responsive tumor microenvironments

Kevin C Barry et al. Nat Med. 2018 Aug.

Abstract

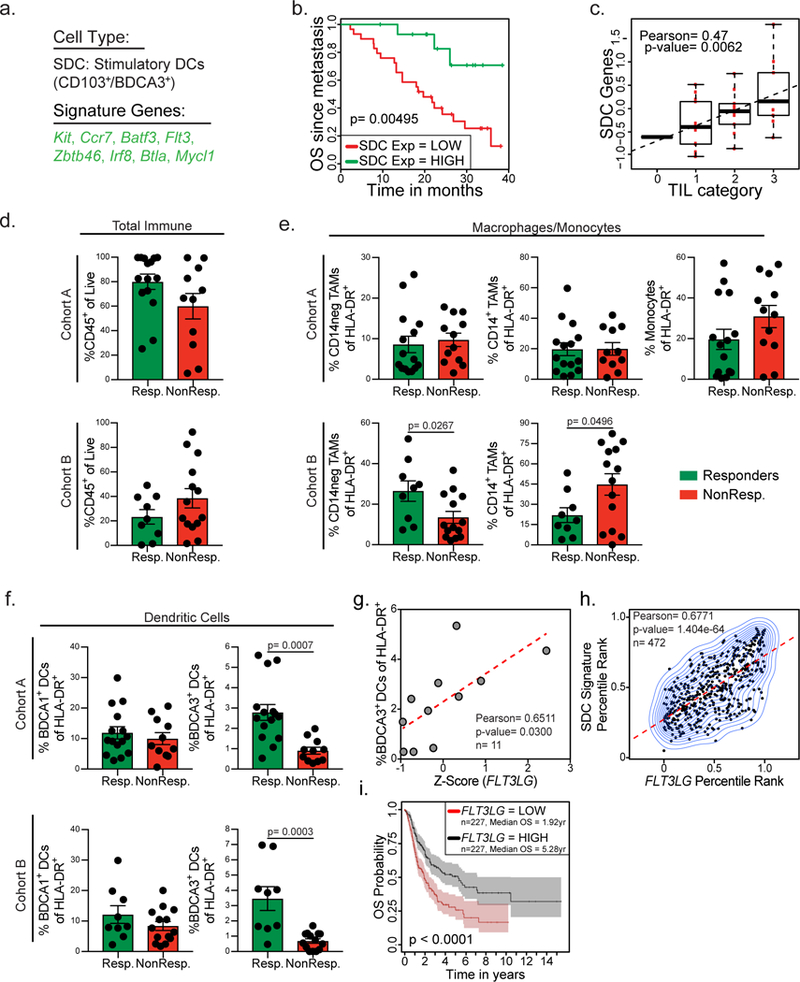
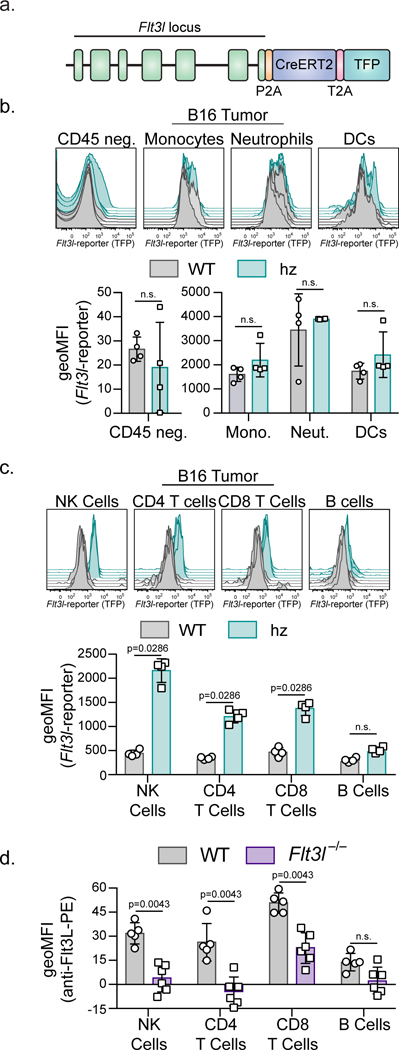
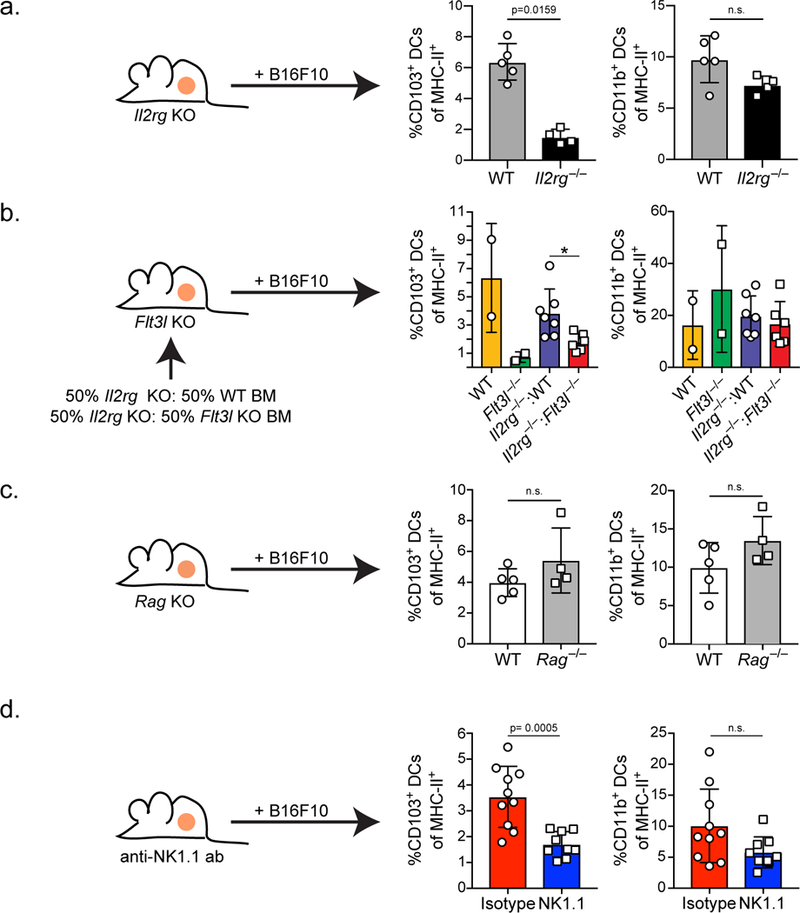
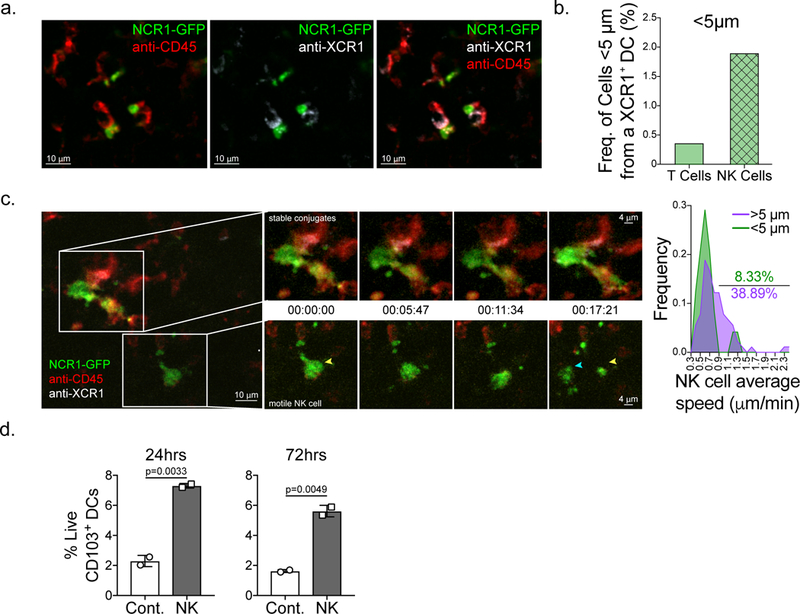
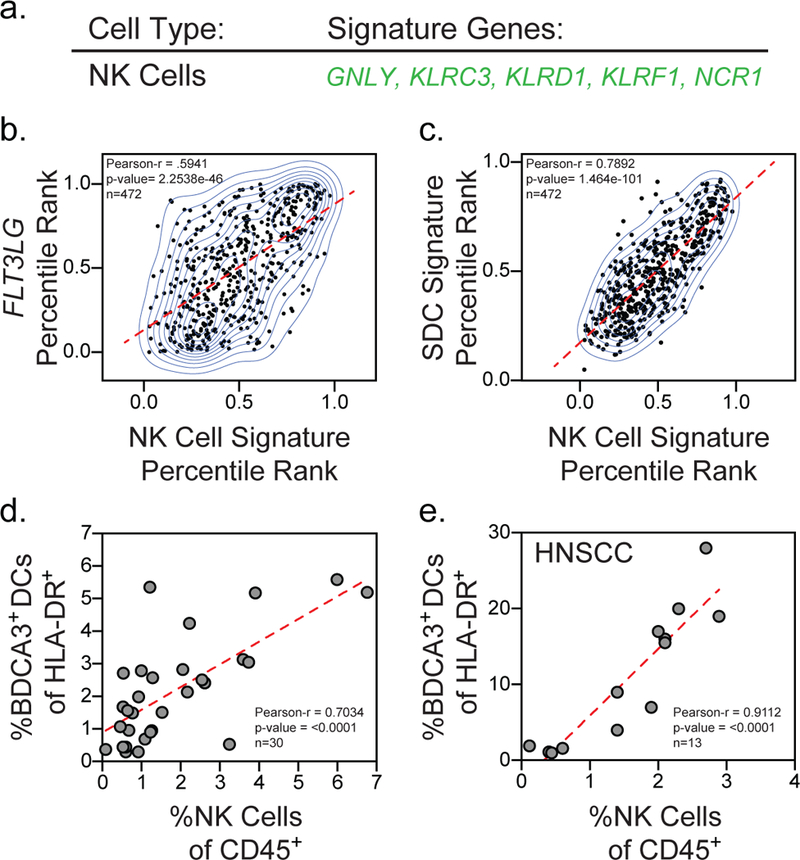
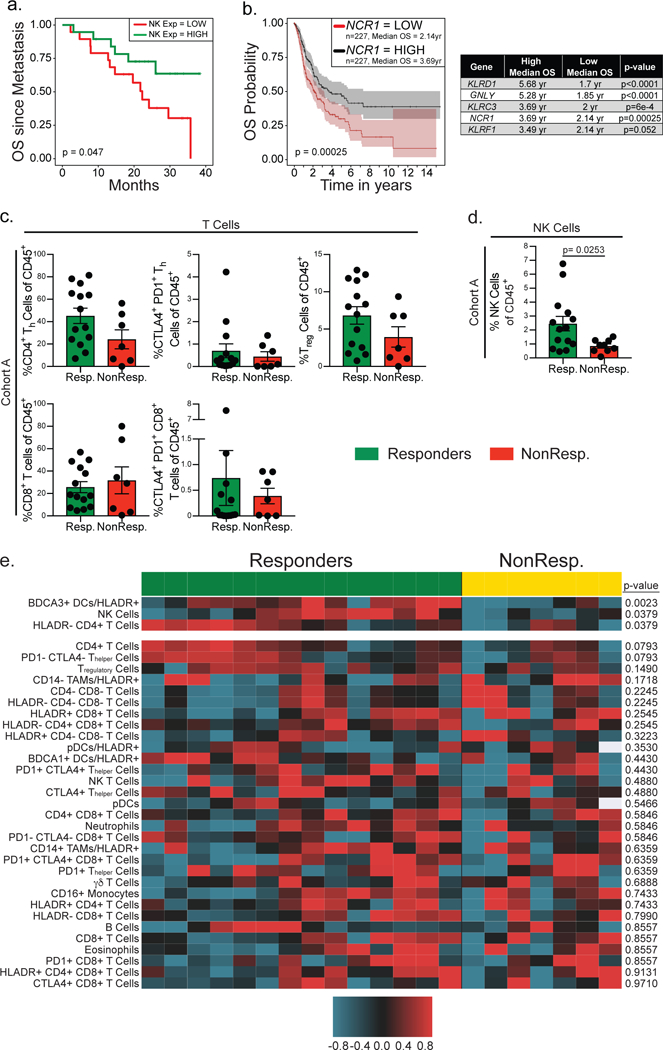
Intratumoral stimulatory dendritic cells (SDCs) play an important role in stimulating cytotoxic T cells and driving immune responses against cancer. Understanding the mechanisms that regulate their abundance in the tumor microenvironment (TME) could unveil new therapeutic opportunities. We find that in human melanoma, SDC abundance is associated with intratumoral expression of the gene encoding the cytokine FLT3LG. FLT3LG is predominantly produced by lymphocytes, notably natural killer (NK) cells in mouse and human tumors. NK cells stably form conjugates with SDCs in the mouse TME, and genetic and cellular ablation of NK cells in mice demonstrates their importance in positively regulating SDC abundance in tumor through production of FLT3L. Although anti-PD-1 'checkpoint' immunotherapy for cancer largely targets T cells, we find that NK cell frequency correlates with protective SDCs in human cancers, with patient responsiveness to anti-PD-1 immunotherapy, and with increased overall survival. Our studies reveal that innate immune SDCs and NK cells cluster together as an excellent prognostic tool for T cell-directed immunotherapy and that these innate cells are necessary for enhanced T cell tumor responses, suggesting this axis as a target for new therapies.


Figures

Figure 1.
Figure 1.. BDCA3+ DCs define overall outcome in melanoma patients and predict responsiveness to anti-PD-1 immunotherapy.
(a) Signature genes identifying SDC (from3). (b) Kaplan-Meier plot for post recurrence survival of metastatic melanoma patients for SDC gene list expression. Data from (n = 44 metastatic melanoma samples from 38 biologically independent patients) are parsed into “high” (green; n=15 metastatic melanoma tumor samples) and “low” (red; n=29 metastatic melanoma tumor samples) bins at 66% stringency threshold for levels of expression of the SDC genes. p-value calculated by log rank test after adjusting for multiple comparisons. (c) Class-based measures of TIL category from plotted versus SDC gene signature (n=33 metastatic melanoma samples). Data plotted as box and whisker plot (box ends= upper and lower quartiles, middle line= median, error bars= maximum and minimum value) with regression line superimposed. TIL categories defined as: 0: 0–5% (n=1), 1: 5–25% (n=13), 2: 25–50% (n=10), 3: 50–100% (n=9). Correlation assessed using the Pearson correlation coefficient and two-tailed p-value. (d-f) Quantified frequency of percentage of CD45+ immune cells of total cells (d), Macrophage/Monocyte populations of HLA-DR+ cells (e), and dendritic cell populations of total HLA-DR+ cells (f) in the tumor of individuals. Patients binned as either responders (green, including partial or complete responses) or non-responders (red, including stable disease and progressive disease). Data were collected from two independent patient cohorts, pooled across patients, and analyzed by two-tailed unpaired parametric t-test, and presented as mean ± S.E.M. with all individual points shown. Cohort A: n=26 samples collected from 24 biologically independent patients (Resp.: n=15 samples from 15 patients, NonResp.: n=11 from 9 patients). Cohort B: n=23 biologically independent patient samples (Resp.: n=9 and NonResp.: n=14 independent patient samples). (g) Z-score of FLT3LG expression in total live cells plotted versus BDCA3+ DC levels of total HLA-DR+ cells in a subset of human melanoma patients in cohort A (n=11 biologically independent metastatic melanoma samples). Data plotted as scatter plot with regression line superimposed (dotted red line); correlation assessed using the Pearson correlation coefficient and two-tailed p-value. (h) Percentile rank of SDC gene expression plotted versus normalized expression of FLT3LG in tumors from the TCGA melanoma dataset. Correlation of n=472 independent patient samples was assessed using the Pearson correlation coefficient and two-tailed p-value. (i) Kaplan-Meier plot for overall survival of melanoma patients median split for FLT3LG gene expression. Data from are parsed into “high” (black; n=227 biologically independent patient samples) and “low” (red; n=227 biologically independent patient samples) bins at 50% stringency threshold for levels of expression of FLT3LG. Plots and statistics generated by the UZH TCGA Cancer Browser. Shaded regions identify 95% confidence interval; p-value calculated by log rank test after adjusting for multiple comparisons.
Figure 2.
Figure 2.. Tumor resident lymphocytes produce Flt3l.
(a) Cartoon diagram of the Flt3l-reporter mouse. (b) Representative flow plots and geometric mean fluorescent intensity (MFI) of Flt3l-reporter expression in CD45 negative and myeloid cells found in two-week-old B16F10 tumors in WT (grey, n=4 biologically independent animals) and Flt3l-reporter homozygous (teal, n=4 biologically independent animals) mice. Monocytes (CD45+, CD11b+, Ly6Chi), neutrophils (CD45+, CD11b+,Ly6Cmid), DCs (CD45+, CD90.2, CD45R, Ly6G, NK1.1, Ly6C, F4/80, MHC-II+, CD24+). (c) Representative flow plots and geometric mean fluorescent intensity (MFI) of Flt3l-reporter expression in NK cells, CD4+ T cells, CD8+ T cells, and B cells (MHC-II+, B220+) found in two-week-old B16F10 tumors in WT (grey; n=4 biologically independent animals) and Flt3l-reporter homozygous (teal; n=4 biologically independent animals) mice. (b-c) Gating strategy depicted in Supplementary Figure 3. (d) Geometric MFI of Flt3L surface protein expression in NK cells, CD4+ T cells, CD8+ T cells, and B cells found in two-week-old B16F10 tumors in WT (grey; n=5 biologically independent animals) or Flt3l-deficient (purple; n=6 biologically independent animals) mice stained with anti-Flt3L antibody. (a-d) Quantification plotted as mean ± S.D and analyzed by Mann-Whitney U Test to generate two-tailed p-values. Data are representative of three (b-c) and two (d) independent replicates.
Figure 3.
Figure 3.. Flt3L production by NK cells controls the levels of CD103+ DCs in the tumor.
(a) Quantification of CD103+ and CD11b+ DCs of total MHC-II+ cells in two-week-old ectopic B16F10 tumors from WT (grey; n=5 biologically independent animals) or Il2rg−/− (black; n=4 biologically independent animals) mice. (b) Quantification of CD103+ and CD11b+ DCs of total MHC-II+ cells in two-week-old ectopic B16F10 tumors from mixed bone marrow chimeras reconstituted with a 50:50 mixture of Il2rg−/−:WT (blue; n=7 biologically independent animals) or Il2rg−/−:Flt3l−/− (red; n=6 biologically independent animals), and WT (yellow; n=2 biologically independent animals) and Flt3l−/− (green; n= 2 biologically independent animals) controls. * = p=0.0140. Data are combined from 2 independent experimental replicates. (c) Quantification of CD103+ and CD11b+ DCs as a proportion of total MHC-II+ cells in two-week-old B16F10 tumors from WT (white; n=5 biologically independent animals) or Rag−/− (grey; n=4 biologically independent animals) mice. (d) Quantification of CD103+ and CD11b+ DCs as a proportion of total MHC-II+ cells in two-week-old B16F10 tumors from WT mice treated with isotype control (red; n=10 biologically independent animals) or mice treated with anti-NK1.1 antibody (blue; n=9 biologically independent animals) every 3 days, starting 3 days prior to tumor injection. (a-d) Plotted as mean ± S.D and analyzed by Mann-Whitney U Test (a-c) or unpaired parametric test (d) to generate two-tailed p-values. (a-d) Data are representative of two independent experimental replicates.
Figure 4.
Figure 4.. NK cells make frequent, stable interactions with XCR-1+ DCs and provide pro-survival signals.
(a-b) Still images from live 2-photon imaging of ectopic B78 melanoma tumor slices from Ncr1-GFP (green) mice stained with anti-XCR1 (white) and anti-CD45 (red) antibodies. (a) Example of static interactions between NK cells and XCR1+ DCs. Representative images from three biologically independent tumors. See also Supplementary Video S1. (b) Quantification of the number of transferred ubiquitin-CFP OT-I CD8+ T cells and endogenous NK cells less than 5μm from a XCR1+ DC in B78cherryOVA tumors in a triple reporter mouse expressing Ncr1-GFP, Xcr1-venus, and CD11c-mCherry. Still images from two biologically independent tumors were used for calculations. (c) Still images of dynamic NK cell-DC interactions. Insets show a time series of two regions of interest where NK cells are in close proximity (< 5μm) to XCR1+ DCs and making stable interactions (top) and a NK cell greater than 5 μm from a XCR1+ DC (bottom) with much more motility. Yellow arrow head, NK cell starting point. Blue arrow head, NK cell ending point. NK cell speeds were quantified (n=114 individual cells) and NK cells were parsed by proximity to XCR1+ DCs (< 5μm or > 5μm from an XCR1+ DC), speeds binned into 22 bins ranging from 0.3–2.4 μm/min, and plotted as an XY plot of Frequency of NK cells by speed. Images are representative of three independent biological replicates. See also Supplementary Video 2. (d) CD103+ DCs from pooled steady state mouse lymph nodes were sorted and incubated with WT NK cells and survival was measured by staining with viability dye at 24hrs and 72hrs of incubation (n=3 technical replicates per treatment group). Data are representative of three biological replicates.
Figure 5.
Figure 5.. BDCA3+ DC levels correlate with levels of NK cells in the human melanoma tumor microenvironment.
(a) NK cell gene signature. (b) Percentile rank normalization of FLT3LG expression plotted versus the percentile rank of the NK cell gene signature for individual patients in the TCGA melanoma dataset (n=472 biologically independent melanoma tumor samples). (c) Percentile rank normalization of the SDC gene signature (Fig. 1a) plotted versus the percentile rank of the NK cell gene signature for individual patients in the TCGA melanoma dataset (n=472 biologically independent melanoma tumor samples). (d) Quantification of NK cells of total CD45+ cells plotted versus quantification of BDCA3+ DC of total HLA-DR+ cells for individual melanoma patients in cohort A (n=30 tumor samples from 29 patients). (e) Quantification of NK cells of total CD45+ cells plotted versus quantification of BDCA3+ DC of total HLA-DR+ cells for individual patients in a cohort of head and neck squamous cell carcinoma patient samples (n=13 biologically independent tumor samples). (a-d) Data plotted as scatter plot with regression line superimposed (dotted red line); correlation assessed using the Pearson correlation coefficient and two-tailed p-value.
Figure 6.
Figure 6.. NK cell and BDCA3+ DC levels uniquely correlate with anti-PD-1 responsiveness in melanoma patients.
(a) Kaplan-Meier plot of overall survival of metastatic melanoma patients. Data (from , n = 38 biologically independent primary metastatic melanoma samples) are parsed into “high” (green; n=19 biologically independent metastatic melanoma samples) and “low” (red; n=19 biologically independent metastatic melanoma samples) bins at 50% (median) stringency thresholds for levels of expression of the NK cell genes. Two-tailed p-value calculated by log rank test after adjusting for multiple comparisons. (b) Kaplan-Meier plot for overall survival of melanoma patients median split for the gene expression of the NK cell specific gene NCR1 and individual survival statistics for each gene in the NK cell gene signature. Data from are parsed into “high” (black; n=227 biologically independent melanoma samples) and “low” (red; n=227 biologically independent melanoma samples) bins at 50% stringency threshold for levels of expression of NCR1, KLRD1, GNLY, KLRC3, or KLRF1. Plots and statistics generated by the UZH TCGA Cancer Broswer. n=454 biologically independent melanoma patient samples; shaded regions identify 95% confidence interval; two-tailed p-value calculated by log rank test after adjusting for multiple comparisons. (c) Frequency of T cell populations (CD4+ Thelper, CD4+ Tregulatory, and CD8+ T cells) of CD45+ cells in the tumor of individuals. Patients binned as either responders (green, including partial or complete responses; n=14 biologically independent metastatic melanoma tumor samples) or non-responders (red, including stable disease and progressive disease; n=7 biologically independent metastatic melanoma tumor samples). (d) Frequency of NK cells of total CD45+ cells in the tumor of individuals. Patients binned as either responders (green, including partial or complete responses; n=14 biologically independent metastatic melanoma tumor samples) or non-responders (red, including stable disease and progressive disease; n=9 biologically independent metastatic melanoma tumor samples). (c-d) Data were analyzed by two-tailed unpaired parametric t-test, and presented as mean ± S.E.M. with all individual points shown. (e) Heat map of 33 cell populations defined from flow cytometric analysis of a subset of melanoma samples from cohort A (n=21 biologically independent metastatic melanoma tumor samples from 20 patients) separated by anti-PD1 responders (green; partial or complete responses; n=14 biologically independent samples) and non-responder (yellow; stable and progressive disease; n=7 samples from 6 patients). For each population two-tailed p-values were calculated with the Wilcoxon rank-sum test. All populations are a fraction of total CD45+ immune cells unless otherwise noted. Data for each row were logged and mean-centered.

Comment in

  • Sequencing cells of the immune TME.
    Killock D. Killock D. Nat Rev Clin Oncol. 2018 Sep;15(9):531. doi: 10.1038/s41571-018-0069-0. Nat Rev Clin Oncol. 2018. PMID: 29985469 No abstract available.

References

    1. Topalian SL, Drake CG & Pardoll DM Immune checkpoint blockade: A common denominator approach to cancer therapy. Cancer Cell 27, 451–461 (2015). - PMC - PubMed
    1. Rizvi NA et al. Mutational landscape determines sensitivity to PD-1 blockade in non-small cell lung cancer. Science (80-. ). 348, 124–128 (2015). - PMC - PubMed
    1. Broz ML et al. Dissecting the Tumor Myeloid Compartment Reveals Rare Activating Antigen-Presenting Cells Critical for T Cell Immunity. Cancer Cell 26, 638–652 (2014). - PMC - PubMed
    1. Salmon H et al. Expansion and Activation of CD103+ Dendritic Cell Progenitors at the Tumor Site Enhances Tumor Responses to Therapeutic PD-L1 and BRAF Inhibition. Immunity 44, 924–938 (2016). - PMC - PubMed
    1. Sanchez-Paulete AR et al. Cancer immunotherapy with immunomodulatory anti-CD137 and ant-PD-1 monoclonal antibodies requires BATF3-dependent dendritic cells. Cancer Discov. 6, 71–79 (2016). - PMC - PubMed

Methods only References

    1. Benjamini Y & Hochberg Y Controlling the false discovery rate: a practical and powerful approach to multiple testing. Journal of the Royal Statistical Society B 57, 289–300 (1995).
    1. Wu C, Jin X, Tsueng G, Afrasiabi C & Su AI BioGPS: Building your own mash-up of gene annotations and expression profiles. Nucleic Acids Res. 44, D313–D316 (2016). - PMC - PubMed
    1. Ruffell B et al. Leukocyte composition of human breast cancer. Proc. Natl. Acad. Sci. U. S. A. 109, 2796–801 (2012). - PMC - PubMed
    1. Li H & Durbin R Fast and accurate short read alignment with Burrows-Wheeler transform. Bioinformatics 25, 1754–1760 (2009). - PMC - PubMed
    1. Li B & Dewey CN RSEM: accurate transcript quantification from RNA-Seq data with or without a reference genome. BMC Bioinformatics 12, 323 (2011). - PMC - PubMed

Publication types