. 2018 Jul;24(7):1070-1080.
doi: 10.1038/s41591-018-0061-3. Epub 2018 Jun 25.

Molecular phenomics and metagenomics of hepatic steatosis in non-diabetic obese women

Affiliations

Molecular phenomics and metagenomics of hepatic steatosis in non-diabetic obese women

Lesley Hoyles et al. Nat Med. 2018 Jul.

Erratum in

  • Publisher Correction: Molecular phenomics and metagenomics of hepatic steatosis in non-diabetic obese women.
    Hoyles L, Fernández-Real JM, Federici M, Serino M, Abbott J, Charpentier J, Heymes C, Luque JL, Anthony E, Barton RH, Chilloux J, Myridakis A, Martinez-Gili L, Moreno-Navarrete JM, Benhamed F, Azalbert V, Blasco-Baque V, Puig J, Xifra G, Ricart W, Tomlinson C, Woodbridge M, Cardellini M, Davato F, Cardolini I, Porzio O, Gentileschi P, Lopez F, Foufelle F, Butcher SA, Holmes E, Nicholson JK, Postic C, Burcelin R, Dumas ME. Hoyles L, et al. Nat Med. 2018 Oct;24(10):1628. doi: 10.1038/s41591-018-0169-5. Nat Med. 2018. PMID: 30093731

Abstract

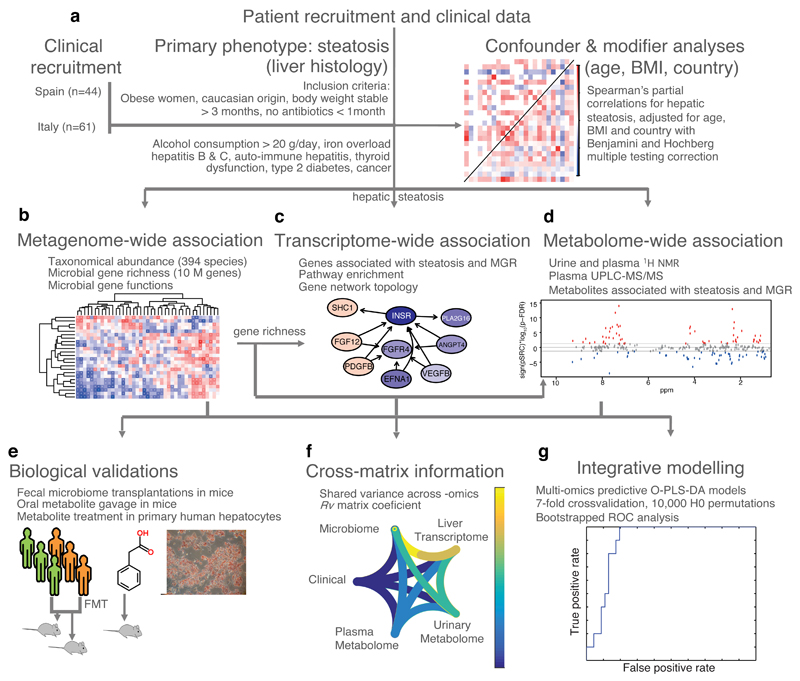
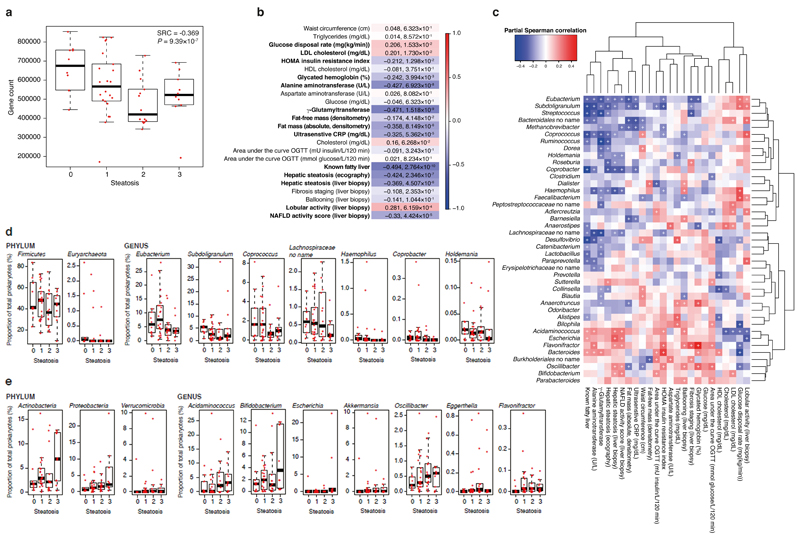
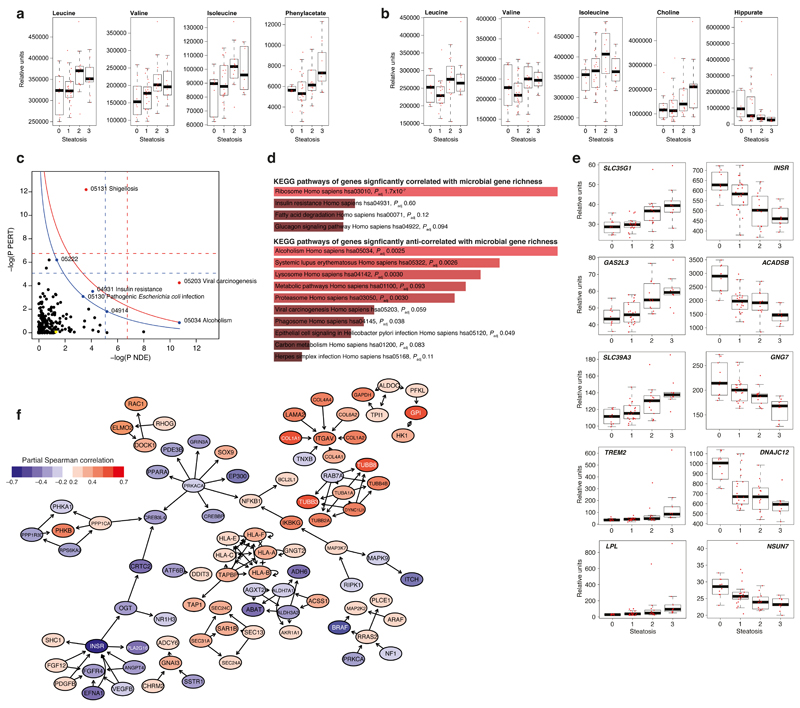
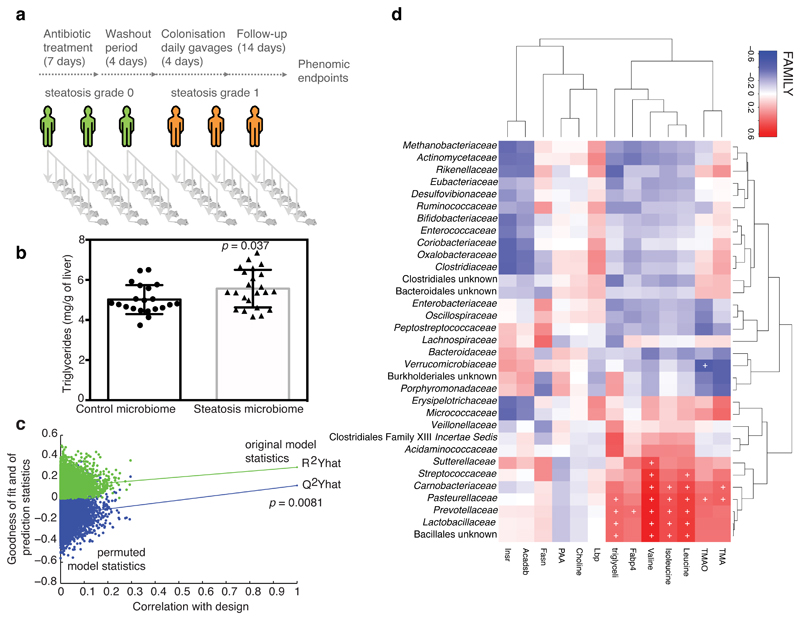
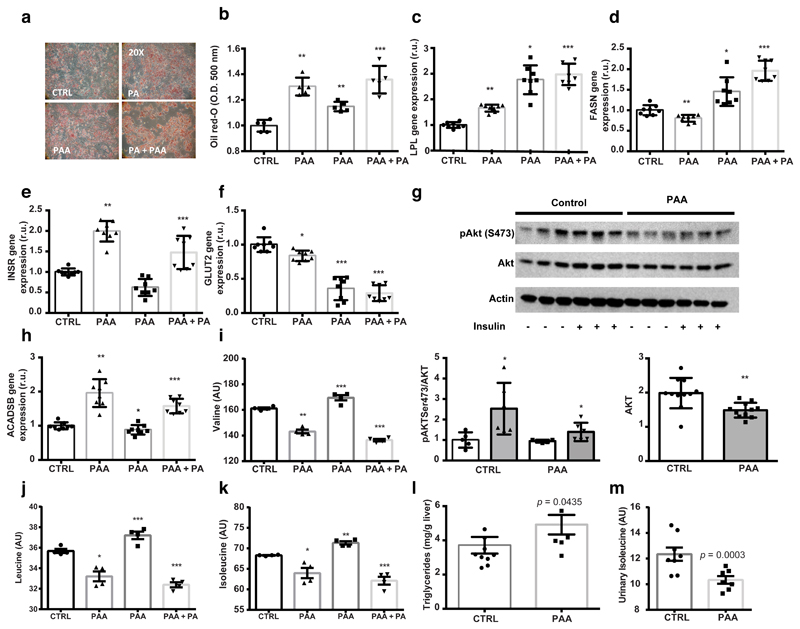
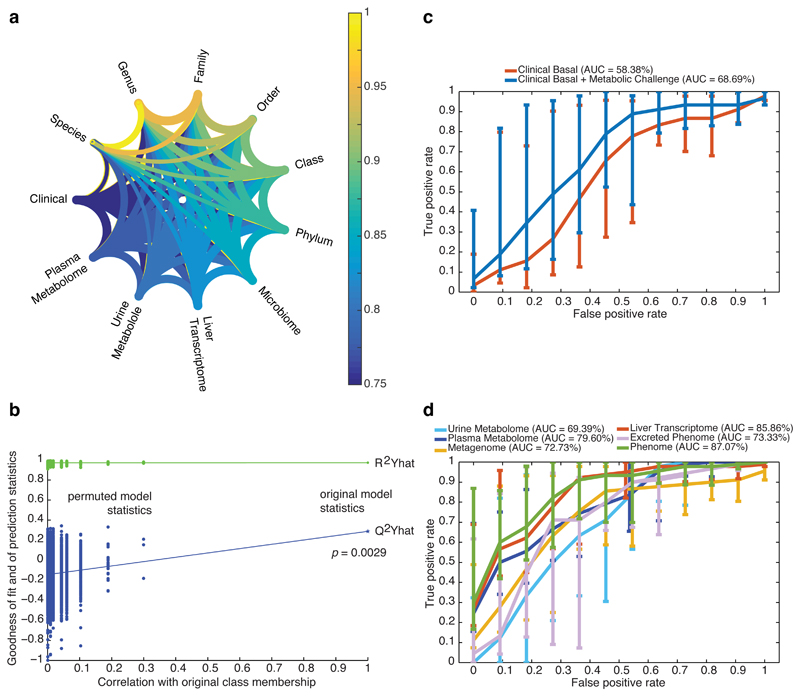
Hepatic steatosis is a multifactorial condition that is often observed in obese patients and is a prelude to non-alcoholic fatty liver disease. Here, we combine shotgun sequencing of fecal metagenomes with molecular phenomics (hepatic transcriptome and plasma and urine metabolomes) in two well-characterized cohorts of morbidly obese women recruited to the FLORINASH study. We reveal molecular networks linking the gut microbiome and the host phenome to hepatic steatosis. Patients with steatosis have low microbial gene richness and increased genetic potential for the processing of dietary lipids and endotoxin biosynthesis (notably from Proteobacteria), hepatic inflammation and dysregulation of aromatic and branched-chain amino acid metabolism. We demonstrated that fecal microbiota transplants and chronic treatment with phenylacetic acid, a microbial product of aromatic amino acid metabolism, successfully trigger steatosis and branched-chain amino acid metabolism. Molecular phenomic signatures were predictive (area under the curve = 87%) and consistent with the gut microbiome having an effect on the steatosis phenome (>75% shared variation) and, therefore, actionable via microbiome-based therapies.


Conflict of interest statement

Competing financial interests. L.H., J.-M.F.-R., M.F., R.H.B., J.L.L., E.H., J.K.N., C.P., R.B. and M.-E.D. are named as co-inventors on pending patents held by INSERM Transfert, INSERM, University of Rome Tor Vergata, University of Girona and Imperial College on non-alcoholic fatty liver disease diagnostics and have the right to receive royalty payments for inventions or discoveries related to non-alcoholic fatty liver disease diagnostics.

Figures

Figure 1
Figure 1. Flowchart showing approach used for the integration of clinical, molecular phenomics and metagenomic information and biological validations.
a, Confounder and modifier analysis performed using linear models on the FLORINASH clinical markers identified three confounders: age, BMI and country (n = 105). Subsequent analyses were performed using partial Spearman’s rank-based correlation (pSRC) coefficients adjusted for age, BMI and country and corrected for multiple testing using the Benjamini and Hochberg criterion (p-FDR). b, Metagenome-wide and phenome-wide association of taxonomic abundance data with clinical markers (n = 56 patients, pSRC, p-FDR < 0.05). c, Network analysis of hepatic transcriptome (n = 56 patients, pSRC, p-FDR < 0.05). d, Metabolome-Wide Association Study based on plasma (n = 56) and urine (n = 102, pSRC, p-FDR < 0.05) 1H-NMR spectra. e, In vitro and in vivo pre-clinical validation protocols. f, Integrative comparison analysis using Rv coefficients (n = 56). g, Predictive performance of an O-PLS-DA model integrating all metagenomic and phenomic modalities for prediction of non-alcoholic fatty liver (no hepatic steatosis, score = 0, n = 10 vs. steatosis, score > 0, n = 46) in ROC curves. All tests are two-sided.
Figure 2
Figure 2. Association between liver steatosis, microbial gene richness (MGR) and metagenomic data in obese women.
a, Boxplots showing that MGR was significantly anti-correlated with liver steatosis using Spearman’s rank-based correlation, adjusted for age, BMI and sex (pSRC, two-sided, n = 56). b, Heatmap showing the significant correlation of MGR with clinical data (n = 56, pSRC, two-sided, p-FDR < 0.05 values shown). c, Heatmap showing the association of genus-level abundance data with clinical data. (n = 56, pSRC, two-sided, + p-FDR < 0.05). (d-e) Boxplots showing prokaryotic taxa significantly associated with hepatic steatosis. d, Prokaryotic taxa significantly anti-correlated with liver steatosis at the phylum and genus levels (n = 56, pSRC, two-sided, p-FDR < 0.05, see Supplementary Table S6 for exact and BH-adjusted p-values). e, Prokaryotic taxa significantly correlated with liver steatosis at the phylum and genus levels (n = 56, pSRC, two-sided, p-FDR < 0.05 see Supplementary Table S6 for exact and BH-adjusted p-values). For all panels, n = 56, groups as no liver steatosis = 10; liver steatosis 1 = 22; liver steatosis 2 = 14; liver steatosis 3 = 10. All boxplots are median + interquartile range, error bars are 1.5 times interquartile range.
Figure 3
Figure 3. Association of metabolomic and transcriptomic data with liver steatosis and microbial gene richness (MGR).
(a-b) Metabolome-wide association with steatosis (n = 56, pSRC, two-sided, p-FDR < 0.05, See Supplementary Table 7 for exact and BH-adjusted p-values). Boxplots showing plasma (a) and urinary (b) metabolites most significantly partially correlated with liver steatosis. (c-f) Transcriptome-wide association with steatosis and MGR (n=56, pSRC, two-sided, p-FDR < 0.05, see Supplementary Table 9-10 for exact and BH-adjusted p-values) c, SPIA evidence plot for the 2,277 genes significantly associated with liver steatosis and MGR. The pathways above the oblique lines are significant (< 0.2) after Bonferroni correction of the global P values (pG, obtained by combining the pPERT and pNDE using the normal inversion method, in red) and after a FDR correction of the global P values, pG (in blue). The yellow node represents the KEGG pathway ‘Non-alcoholic fatty liver disease (NAFLD) – Homo sapiens (human)’; 05222, Small cell lung cancer; 4914, Progesterone-mediated oocyte maturation. d, Enrichr (KEGG pathway) analysis of the hepatic genes significantly correlated and anti-correlated with MGR. e, Boxplots showing the ten hepatic genes most significantly correlated and anti-correlated with liver steatosis. f, Topological analysis of the KEGG networks resulting from hepatic steatosis – MGR intersecting genes showing the genes with the highest betweenness centrality, (blue, anti-correlated with steatosis, red correlated with steasosis). For all panels, groups are: no liver steatosis = 10; liver steatosis 1 = 22; liver steatosis 2 = 14; liver steatosis 3 = 10 for all panels. Boxplots are median, with interquartile range and 1.5 times interquartile range.
Figure 4
Figure 4. Transfer of steatotic and metabolic phenotypes to mice through FMT of material from patients with liver steatosis grade 3.
a, FMT protocol. b, Hepatic triglycerides in recipient mice (control microbiome, n = 21 and steatosis microbiome, n = 23, t test, 2-sided). c, Permutation tests for goodness of fit (R2) and prediction (Q2) parameters obtained from a seven-fold cross-validated O-PLS regression model quantitatively predicting recipient mouse hepatic lipid accumulation from human donor microbiome composition (n = 44). d, Heatmap showing the association between human donor microbiota and recipient mouse phenome (n = 44). Predictivity of O-PLS models is validated through 10,000 random permutations of the class membership variable and assessing the significance of the goodness-of-fit (R2, explained variance) and goodness-of-prediction (Q2, predicted variance) parameters. The horizontal axis corresponds to the correlation between the original class membership (on the right) and the permuted class membership (10,000 permutations on the left of the plot). The vertical axis corresponds to the R2 (green dots) and Q2 (blue dots) coefficients. Data obtained from FMT protocols performed independently with faecal material from three patients with liver steatosis (grade 3, >66% steatosis) and three control patients (grade 0, <5% steatosis), Data are mean ± s.e.m., * p < 0.05.
Figure 5
Figure 5. Microbial PAA induces liver steatosis and BCAA use in primary human hepatocytes and mice.
a, Micrographs of primary human hepatocytes stained with oil Red-O (representative images from n = 5 independent batches). b, Quantification of lipid accumulation (n = 5 independent batches, two-sided t test). c, LPL expression in hepatocytes. d, FASN expression in hepatocytes. e, INSR expression in hepatocytes. f, GLUT2 expression in hepatocytes. g, AKT phosphorylation in hepatocytes. h, ACADSB expression in hepatocytes. i, Valine in hepatocyte cell medium. j, Leucine in hepatocyte cell medium. k, Isoleucine in hepatocyte cell medium (c-k) n = 8 independent batches, two-sided t test. l, Hepatic triglycerides in PAA-treated mice (control, n = 10, PAA, n = 7, Mann-Whitney test, one-sided). m, Isoleucine in urine from PAA-treated mice (control, n = 10, PAA, n = 7, Mann-Whitney test, one-sided). Data are mean ± s.e.m., * p < 0.05, ** p < 0.01, *** p < 0.001. Abbreviations: CTRL, control group; PAA, phenylacetic acid treatment group; PA, palmitic acid treatment group; PA+PAA, palmitic acid and phenylacetic acid treatment group.
Figure 6
Figure 6. Phenome-wide crosstalk and predictive modelling.
a, Metagenome–phenome matrix correlation network computed for the patients with matching metagenomic and phenomic profiles (n = 56) using the modified Rv correlation matrix coefficient. Each phenomic table corresponds to a node and edges represent the relationships between tables, i.e., the per cent of shared information, derived from the Rv2 matrix correlation coefficient corresponding to the proportion of variance shared by the two tables – which like a squared Pearson’s correlation coefficient (r2) – corresponds to the proportion of explained variance between two variables. b, Discriminative power of a supervised multivariate model (OPLS-DA) fitted with patients with matching metagenomic and phenomic profiles (n = 56) to predict new samples, using random permutation testing (10,000 iterations). (c-d), Performance of classification of liver steatosis status (n = 10, vs. others, n = 46) based on clinical data (c) or matching molecular phenomic and gut metagenomic profiles (d). ROC curves (mean + 95% confidence interval) were obtained for the cross-validated model predictions derived from the O-PLS-DA model, reaching an AUC of 87.07%, corresponding to the successful prediction rate. Groups for all panels are: no steatosis (grade 0), n = 10; steatosis (grades 1-3), n = 46. Data are mean ± pointwise confidence bounds.

Comment in

References

    1. Saltiel AR, Kahn CR. Insulin signalling and the regulation of glucose and lipid metabolism. Nature. 2001;414:799–806. - PubMed
    1. Kahn SE, Hull RL, Utzschneider KM. Mechanisms linking obesity to insulin resistance and type 2 diabetes. Nature. 2006;444:840–846. - PubMed
    1. Meex RCR, Watt MJ. Hepatokines: linking nonalcoholic fatty liver disease and insulin resistance. Nat Rev Endocrinol. 2017;13:509–520. - PubMed
    1. Petersen MC, Vatner DF, Shulman GI. Regulation of hepatic glucose metabolism in health and disease. Nat Rev Endocrinol. 2017;13:572–587. - PMC - PubMed
    1. Adams LA, Anstee QM, Tilg H, Targher G. Non-alcoholic fatty liver disease and its relationship with cardiovascular disease and other extrahepatic diseases. Gut. 2017;66:1138–1153. - PubMed

Publication types