. 2018 Jun 11:9:1264.
doi: 10.3389/fimmu.2018.01264. eCollection 2018.

PU.1 Is Required for the Developmental Progression of Multipotent Progenitors to Common Lymphoid Progenitors

Affiliations

PU.1 Is Required for the Developmental Progression of Multipotent Progenitors to Common Lymphoid Progenitors

Swee Heng Milon Pang et al. Front Immunol. .

Abstract

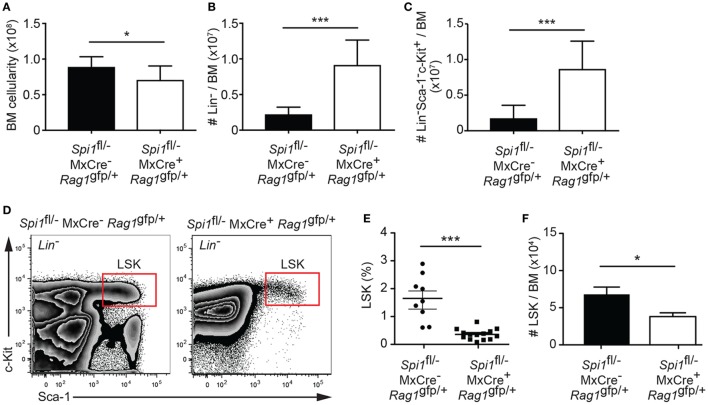
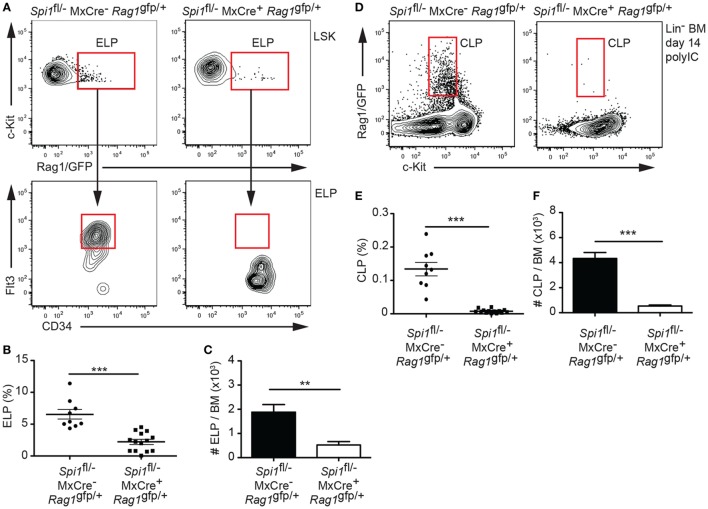
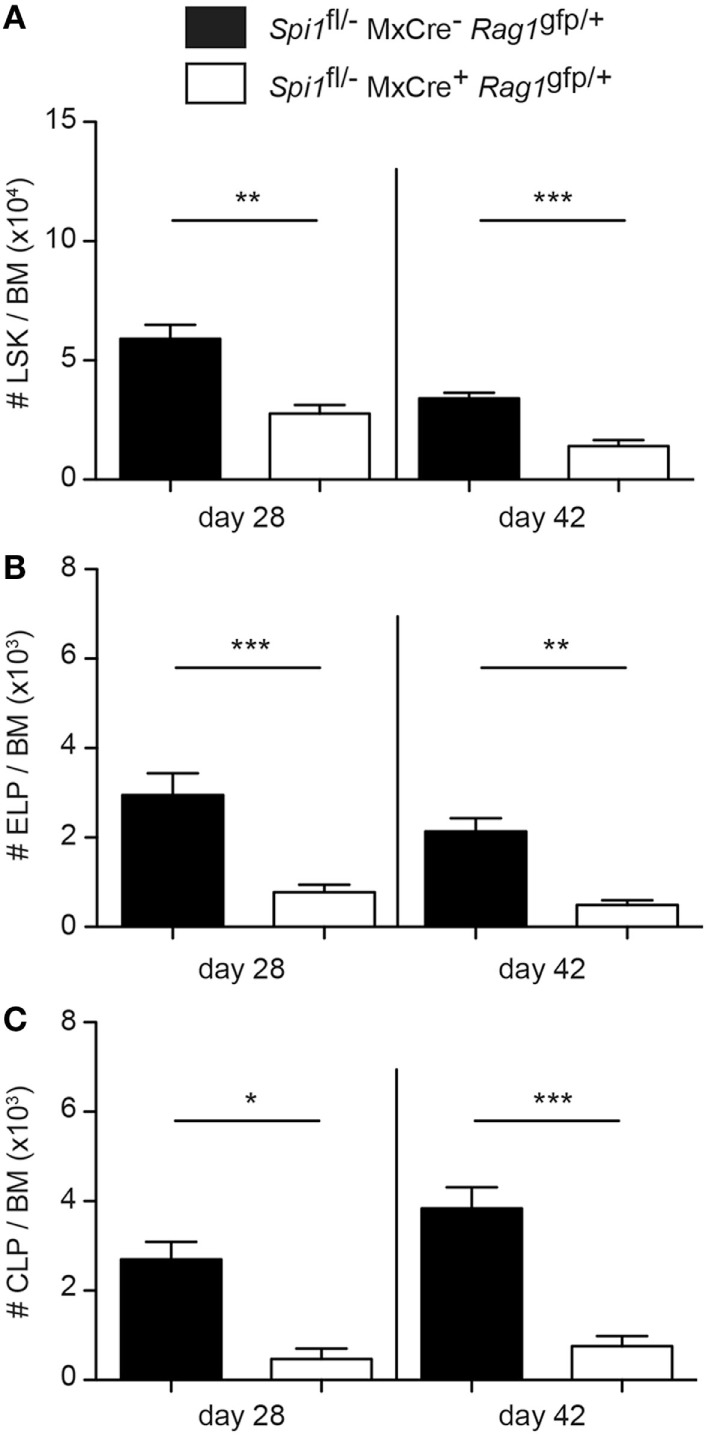
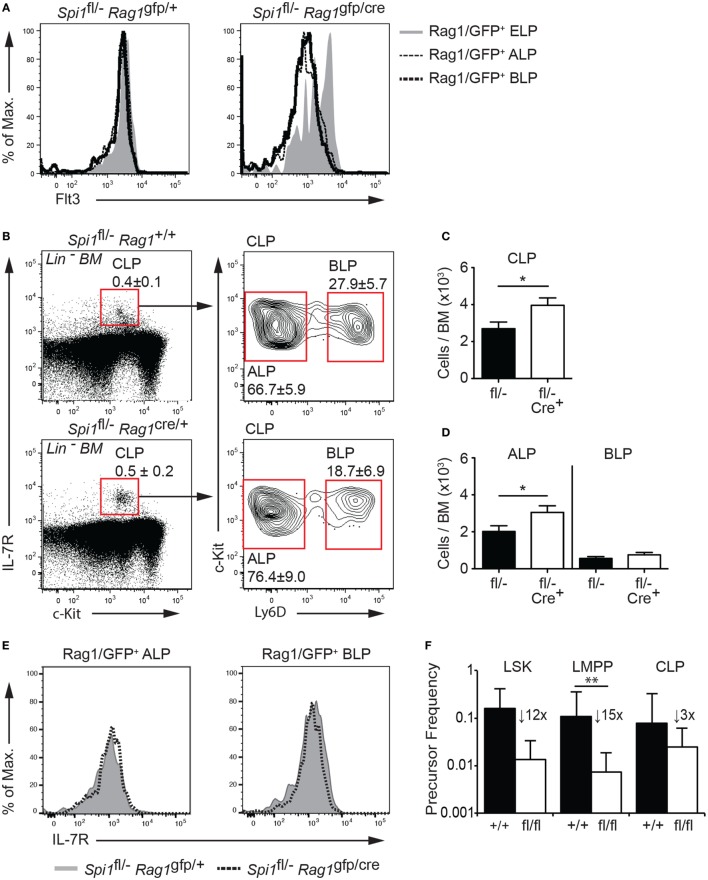
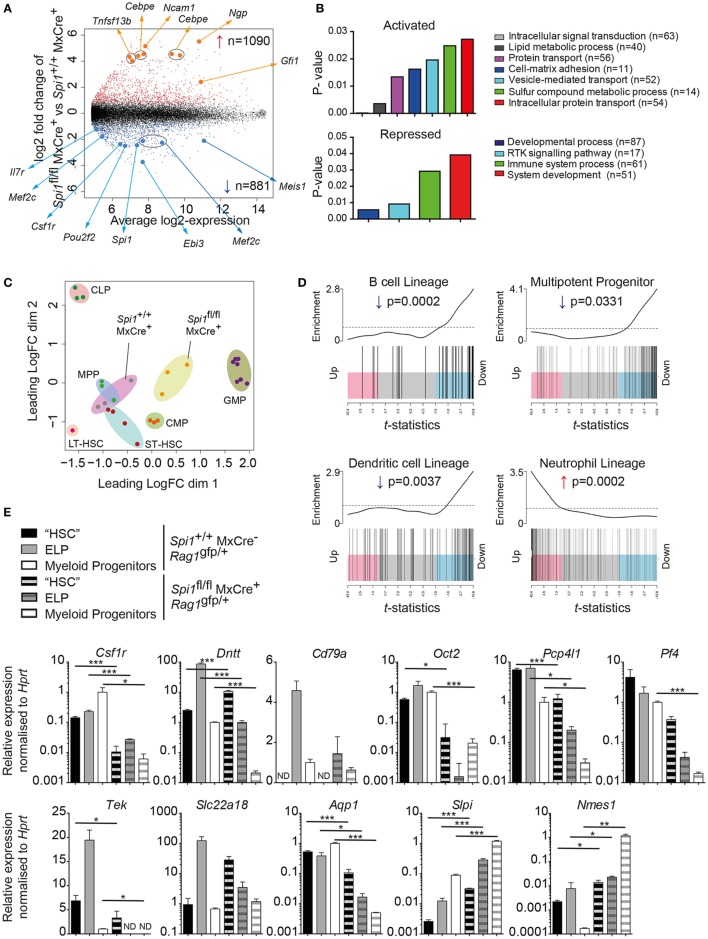
The transcription factor PU.1 is required for the development of mature myeloid and lymphoid cells. Due to this essential role and the importance of PU.1 in regulating several signature markers of lymphoid progenitors, its precise function in early lymphopoiesis has been difficult to define. Here, we demonstrate that PU.1 was required for efficient generation of lymphoid-primed multipotent progenitors (LMPPs) from hematopoietic stem cells and was essential for the subsequent formation of common lymphoid progenitors (CLPs). By contrast, further differentiation into the B-cell lineage was independent of PU.1. Examination of the transcriptional changes in conditional progenitors revealed that PU.1 activates lymphoid genes in LMPPs, while repressing genes normally expressed in neutrophils. These data identify PU.1 as a critical regulator of lymphoid priming and the transition between LMPPs and CLPs.

Keywords: PU.1; Rag1; common lymphoid progenitor; multipotent progenitor; transcription factor.


Figures

Figure 1
Figure 1
Reduced numbers of hematopoietic progenitors from PU.1 conditionally deficient bone marrow (BM). Spi1fl/−MxCreRag1gfp/+ and Spi1fl/−MxCre+Rag1gfp/+ mice were injected with polyIC on days 0 and 3, and analyzed by flow cytometry on day 14. Graph shows (A) the absolute cell numbers in the BM (2× femur and tibia), (B) the number of Lin cells, and (C) the number of LinSca-1c-Kit+ cells in BM preparation. (D) Representative flow cytometry plot of Lin BM preparations from the mice of indicated genotypes. Boxes indicate the position of the LSK populations. (E) Graph shows the proportion of LSK cells in Lin BM preparation. Each dot represents an individual BM sample. Horizontal line shows the mean ± SD. (F) Absolute LSK cell numbers in the BM. Data in the graphs are the mean cell number ± SD from between 9 and 14 mice per genotype. p Values compare the indicated groups using an unpaired t-test. *p < 0.05, ***p < 0.001.
Figure 2
Figure 2
Absence of lymphoid progenitors from PU.1 conditionally deficient bone marrow (BM). Spi1fl/−MxCreRag1gfp/+ and Spi1fl/−MxCre+Rag1gfp/+ mice were injected with polyIC on days 0 and 3, and analyzed by flow cytometry on day 14. (A) Upper plots, representative flow cytometry plot of the LSK populations, gated as in Figure 1D, from the mice of indicated genotypes. Boxes indicate the position of the Rag1/GFP+ early lymphoid progenitor (ELP) populations. Lower plots, ELPs express Flt3 and CD34 in control Spi1fl/−MxCreRag1gfp/+ ELPs, but not in the Spi1fl/−MxCre+Rag1gfp/+ cells, confirming the inactivation of PU.1. (B) Graph shows the proportion of ELPs cells in the LSK cell gate. Each dot represents an individual BM sample. Horizontal line shows the mean ± SD. (C) Absolute ELP numbers in the BM. (D) Representative flow cytometry plot of Lin BM preparations from the mice of indicated genotypes. Boxes indicate the position of the common lymphoid progenitor (CLP)-equivalent populations using Rag1/GFP. (E) Graph shows the proportion of Rag1/GFP+ CLPs cells in the Lin gate. Each dot represents an individual BM sample. Horizontal line shows the mean ± SD. (F) Absolute Rag1/GFP+ CLP numbers in the BM. Data in panels (C,F) are the mean cell number ± SD from between 9 and 14 mice per genotype. p Values compare the indicated groups using an unpaired t-test. **p < 0.01, ***p < 0.001.
Figure 3
Figure 3
Sustained reduction in lymphoid progenitors in PU.1 conditionally deficient bone marrow (BM). Spi1fl/−MxCreRag1gfp/+ and Spi1fl/−MxCre+Rag1gfp/+ mice were injected with polyIC on days 0 and 3, and analyzed by flow cytometry on days 28 and 42. Total numbers of (A) LSK cells, (B) Rag1/GFP+ early lymphoid progenitors, and (C) Rag1/GFP+ common lymphoid progenitors (CLPs) in the BM of indicated genotypes were calculated. The data are mean ± SD from between 5 and 8 mice per genotype. p Values compare the indicated groups using an unpaired t-test. *p < 0.05, **p < 0.01, ***p < 0.001.
Figure 4
Figure 4
PU.1 is not required for the persistence of common lymphoid progenitors (CLPs). (A) Lineage-depleted (Lin) bone marrow (BM) was isolated from Spi1fl/−Rag1+/gfp and Spi1fl/−Rag1cre/gfp mice and Rag1/GFP+ early lymphoid progenitors (ELPs), all lymphocyte progenitors (ALPs), and biased lymphocyte progenitors (BLPs) of each indicated genotype were assessed for Flt3. (B–D) Lin BM from Spi1fl/−Rag1+/+ and Spi1fl/−Rag1cre/+ mice were analyzed for the (B) frequency and (C) number of CLPs and (D) number of ALPs and BLPs. Boxes show the position of gating for the cell type being analyzed. (E) Lineage-depleted (Lin) BM was isolated from Spi1fl/−Rag1+/gfp and Spi1fl/−Rag1cre/gfp mice and Rag1/GFP+ ALPs and BLPs of each indicated genotype were assessed for IL-7R. Data in panels (A,E) are representative of two experiments each consisting of two mice per genotype. Data in panels (B–D) are the mean ± SD from between 9 and 13 mice per genotype. (F) Sorted LSK cells, lymphoid-primed multipotent progenitors (LMPPs), and CLPs from Spi1fl/flCreERT2 and control Spi1+/+CreERT2 mice and cultured in limiting dilution with OP9 stromal cells in the presence of IL-7 and Flt3L for 7–10 days. 350 nM 4-hydroxytamoxifen was added to all cultures on day 1 and diluted threefold after 24 h. The mean clonogenic frequency ±5% confidence interval of two experiments each with triplicate measurements is shown. p Values compare the indicated groups using an unpaired t-test. *p < 0.05, **p < 0.01.
Figure 5
Figure 5
PU.1 is required for lymphoid gene priming in LSK cells. (A–D) Spi1+/+MxCre+ and Spi1fl/flMxCre+ mice were injected with polyIC on days 0 and 3, and LSK cells were isolated by flow cytometry on day 14. Three independent samples of LSK cells from each genotype (each a pool of 15–20 individual mice) were analyzed by gene expression profiling. (A) Scatter plot of differential expression. Genes with significantly increased (red) or decreased (blue) in the absence of PU.1 are indicated (false discovery rate < 0.05). The number of differentially expressed genes is indicated. Position of probes corresponding to genes of interest is highlighted. (B) Bar charts showing gene ontology classification of activated and repressed genes by Panther GO-Slim biological process dataset (p value < 0.05 and fold enrichment > +1). The number of differentially expressed genes in each GO category are indicated (C) MDS plot of top 500 differentially regulated genes to demonstrate the relatedness of gene profiles of the indicated populations. Abbreviations: LT-HSC, long term-hematopoietic stem cell; ST-HSC, short term-HSC; MPP, multipotent progenitor; CLP, common lymphoid progenitor; CMP, common myeloid progenitor; GMP, granulocyte macrophage progenitor; MDS, multi-dimensional scaling. Each dot represents the indicated dataset. Close clustering of biological replicates of each cell type is highlighted by shaded ovals. (D) Barcode plot of B cell, MPP, dendritic cell, and neutrophil gene signatures compared to gene expression changes after Spi1 deletion in LSK cells. Genes (shaded rectangles; horizontally ranked by moderated t-statistic) upregulated (pink; t > 1), downregulated (blue; t < −1) or not altered (gray) in Spi1+/+MxCre+ compared to Spi1fl/flMxCre+ LSK cells. Vertical black lines indicate the genes from the indicated signatures. Top, worm shows relative local enrichment of signature genes in each part of the plot with the dotted horizontal line indicating neutral enrichment. Data of the indicated populations in panels (C,D) were obtained from http://haemosphere.org (42). (E) Quantitative real-time RT-PCR of indicated lymphoid and myeloid associated genes to confirm differential gene expression. Spi1fl/flMxCreRag1gfp/+ and Spi1fl/flMxCre+Rag1gfp/+ mice were injected with polyIC on days 0 and 3, and Rag1/GFP LSK cells (“HSC”), Rag1/GFP+ LSK cells [early lymphoid progenitor (ELP)], and Linc-kit+Sca-1 (myeloid progenitor cells) were isolated by flow cytometry on day 14 (as described in Figure S5 in Supplementary Material). Expression values are the mean ± SD of three independent experiments and are normalized to Hprt. p Values compare the indicated groups using an unpaired t-test. *p < 0.05, **p < 0.01, ***p < 0.001.

Similar articles

Cited by

References

    1. Wilson A, Oser GM, Jaworski M, Blanco-Bose WE, Laurenti E, Adolphe C, et al. Dormant and self-renewing hematopoietic stem cells and their niches. Ann N Y Acad Sci (2007) 1106:64–75. 10.1196/annals.1392.021 - DOI - PubMed
    1. Adolfsson J, Mansson R, Buza-Vidas N, Hultquist A, Liuba K, Jensen CT, et al. Identification of Flt3+ lympho-myeloid stem cells lacking erythro-megakaryocytic potential a revised road map for adult blood lineage commitment. Cell (2005) 121(2):295–306. 10.1016/j.cell.2005.02.013 - DOI - PubMed
    1. Igarashi H, Gregory SC, Yokota T, Sakaguchi N, Kincade PW. Transcription from the RAG1 locus marks the earliest lymphocyte progenitors in bone marrow. Immunity (2002) 17(2):117–30. 10.1016/S1074-7613(02)00366-7 - DOI - PubMed
    1. Akashi K, Kondo M, von Freeden-Jeffry U, Murray R, Weissman IL. Bcl-2 rescues T lymphopoiesis in interleukin-7 receptor-deficient mice. Cell (1997) 89(7):1033–41. 10.1016/S0092-8674(00)80291-3 - DOI - PubMed
    1. Inlay MA, Bhattacharya D, Sahoo D, Serwold T, Seita J, Karsunky H, et al. Ly6d marks the earliest stage of B-cell specification and identifies the branchpoint between B-cell and T-cell development. Genes Dev (2009) 23(20):2376–81. 10.1101/gad.1836009 - DOI - PMC - PubMed

Publication types

MeSH terms