

Transcriptomic and Quantitative Proteomic Analyses Provide Insights Into the Phagocytic Killing of Hemocytes in the Oyster Crassostrea gigas
- PMID: 29942306
- PMCID: PMC6005338
- DOI: 10.3389/fimmu.2018.01280
Transcriptomic and Quantitative Proteomic Analyses Provide Insights Into the Phagocytic Killing of Hemocytes in the Oyster Crassostrea gigas
Abstract
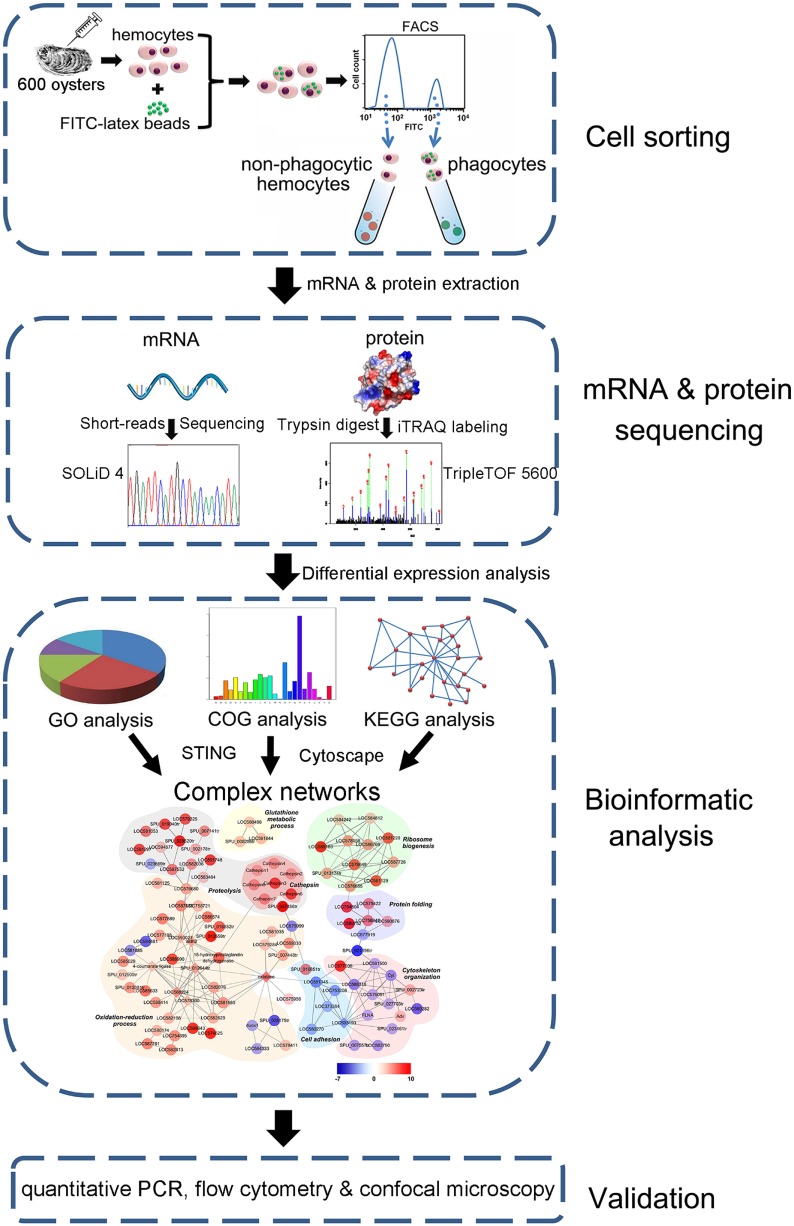
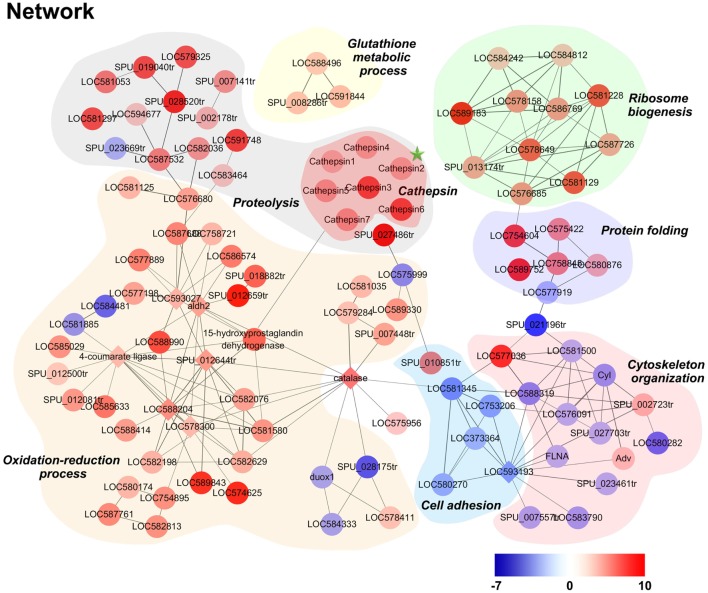
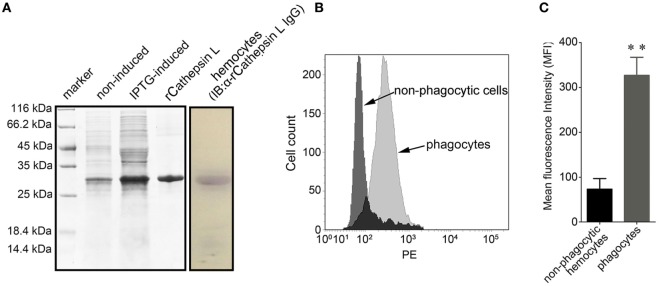
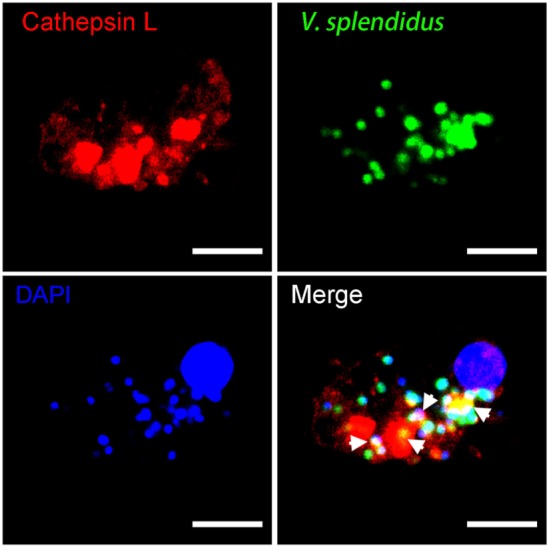
As invertebrates lack an adaptive immune system, they depend to a large extent on their innate immune system to recognize and clear invading pathogens. Although phagocytes play pivotal roles in invertebrate innate immunity, the molecular mechanisms underlying this killing remain unclear. Cells of this type from the Pacific oyster Crassostrea gigas were classified efficiently in this study via fluorescence-activated cell sorting (FACS) based on their phagocytosis of FITC-labeled latex beads. Transcriptomic and quantitative proteomic analyses revealed a series of differentially expressed genes (DEGs) and proteins present in phagocytes; of the 352 significantly high expressed proteins identified here within the phagocyte proteome, 262 corresponding genes were similarly high expressed in the transcriptome, while 140 of 205 significantly low expressed proteins within the proteome were transcriptionally low expressed. A pathway crosstalk network analysis of these significantly high expressed proteins revealed that phagocytes were highly activated in a number of antimicrobial-related biological processes, including oxidation-reduction and lysosomal proteolysis processes. A number of DEGs, including oxidase, lysosomal protease, and immune receptors, were also validated in this study using quantitative PCR, while seven lysosomal cysteine proteases, referred to as cathepsin Ls, were significantly high expressed in phagocytes. Results show that the expression level of cathepsin L protein in phagocytes [mean fluorescence intensity (MFI): 327 ± 51] was significantly higher (p < 0.01) than that in non-phagocytic hemocytes (MFI: 83 ± 26), while the cathepsin L protein was colocalized with the phagocytosed Vibrio splendidus in oyster hemocytes during this process. The results of this study collectively suggest that oyster phagocytes possess both potent oxidative killing and microbial disintegration capacities; these findings provide important insights into hemocyte phagocytic killing as a component of C. gigas innate immunity.
Keywords: Crassostrea gigas; cathepsin L; lysosome; oxidative killing; phagocyte; quantitative proteome; transcriptome.
Figures


Similar articles
-
Phagocyte Transcriptomic Analysis Reveals Focal Adhesion Kinase (FAK) and Heparan Sulfate Proteoglycans (HSPGs) as Major Regulators in Anti-bacterial Defense of Crassostrea hongkongensis.Front Immunol. 2020 Mar 20;11:416. doi: 10.3389/fimmu.2020.00416. eCollection 2020. Front Immunol. 2020. PMID: 32265912 Free PMC article.
-
Molecular characterization of a cathepsin L1 highly expressed in phagocytes of pacific oyster Crassostrea gigas.Dev Comp Immunol. 2018 Dec;89:152-162. doi: 10.1016/j.dci.2018.08.014. Epub 2018 Aug 22. Dev Comp Immunol. 2018. PMID: 30144489
-
Transcriptomic Evidence Reveals the Molecular Basis for Functional Differentiation of Hemocytes in a Marine Invertebrate, Crassostrea gigas.Front Immunol. 2020 May 27;11:911. doi: 10.3389/fimmu.2020.00911. eCollection 2020. Front Immunol. 2020. PMID: 32536915 Free PMC article.
-
The new insights into the oyster antimicrobial defense: Cellular, molecular and genetic view.Fish Shellfish Immunol. 2015 Sep;46(1):50-64. doi: 10.1016/j.fsi.2015.02.040. Epub 2015 Mar 7. Fish Shellfish Immunol. 2015. PMID: 25753917 Review.
-
An analysis of the structural and functional similarities of insect hemocytes and mammalian phagocytes.Virulence. 2013 Oct 1;4(7):597-603. doi: 10.4161/viru.25906. Epub 2013 Aug 6. Virulence. 2013. PMID: 23921374 Free PMC article. Review.
Cited by
-
Phagocyte Transcriptomic Analysis Reveals Focal Adhesion Kinase (FAK) and Heparan Sulfate Proteoglycans (HSPGs) as Major Regulators in Anti-bacterial Defense of Crassostrea hongkongensis.Front Immunol. 2020 Mar 20;11:416. doi: 10.3389/fimmu.2020.00416. eCollection 2020. Front Immunol. 2020. PMID: 32265912 Free PMC article.
-
Immunological Responses of Marine Bivalves to Contaminant Exposure: Contribution of the -Omics Approach.Front Immunol. 2021 Feb 18;12:618726. doi: 10.3389/fimmu.2021.618726. eCollection 2021. Front Immunol. 2021. PMID: 33679759 Free PMC article. Review.
-
Identification of a Novel Pattern Recognition Receptor DM9 Domain Containing Protein 4 as a Marker for Pro-Hemocyte of Pacific Oyster Crassostrea gigas.Front Immunol. 2021 Feb 12;11:603270. doi: 10.3389/fimmu.2020.603270. eCollection 2020. Front Immunol. 2021. PMID: 33643289 Free PMC article.
-
A CD63 Homolog Specially Recruited to the Fungi-Contained Phagosomes Is Involved in the Cellular Immune Response of Oyster Crassostrea gigas.Front Immunol. 2020 Jul 22;11:1379. doi: 10.3389/fimmu.2020.01379. eCollection 2020. Front Immunol. 2020. PMID: 32793193 Free PMC article.
-
Dual Analysis of Virus-Host Interactions: The Case of Ostreid herpesvirus 1 and the Cupped Oyster Crassostrea gigas.Evol Bioinform Online. 2019 Feb 22;15:1176934319831305. doi: 10.1177/1176934319831305. eCollection 2019. Evol Bioinform Online. 2019. PMID: 30828244 Free PMC article. Review.
References
Publication types
MeSH terms
Substances
LinkOut - more resources
Full Text Sources
Other Literature Sources
Research Materials