. 2018 Jun 11:9:1319.
doi: 10.3389/fimmu.2018.01319. eCollection 2018.

Anomalies in T Cell Function Are Associated With Individuals at Risk of Mycobacterium abscessus Complex Infection

Affiliations

Anomalies in T Cell Function Are Associated With Individuals at Risk of Mycobacterium abscessus Complex Infection

Viviana P Lutzky et al. Front Immunol. .

Abstract

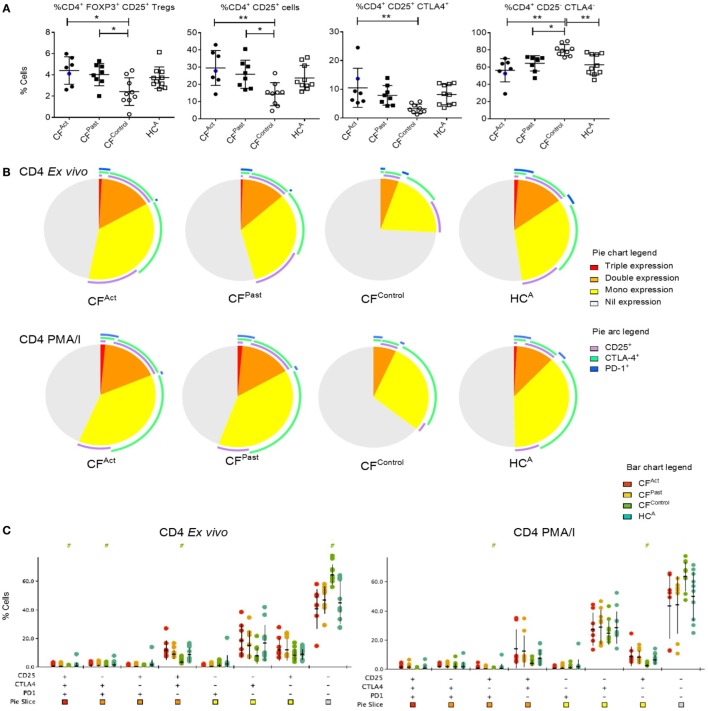
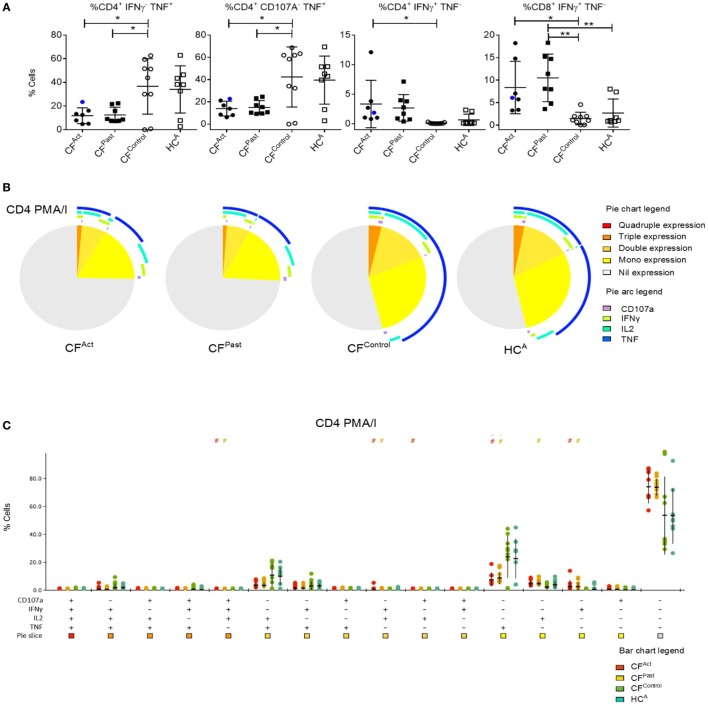
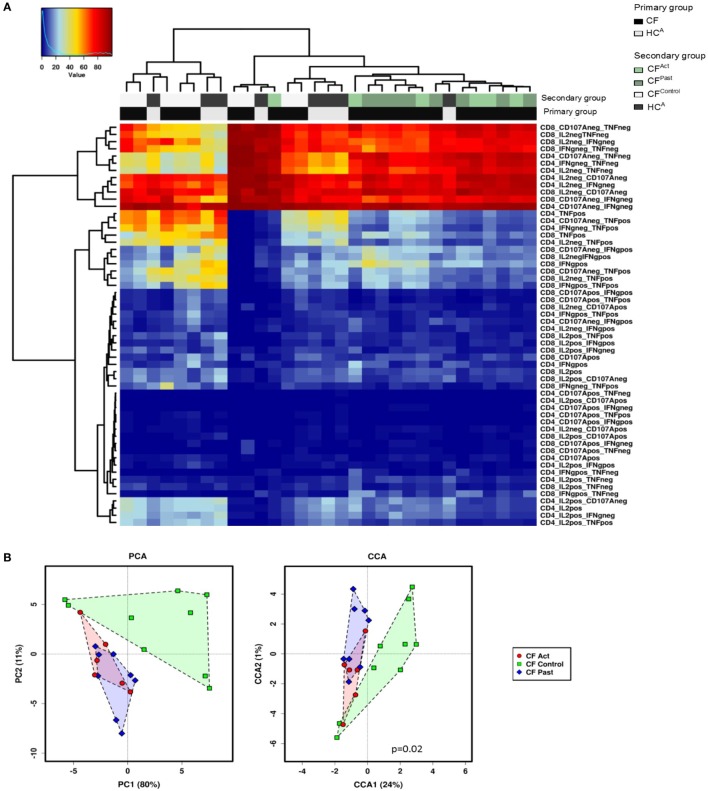
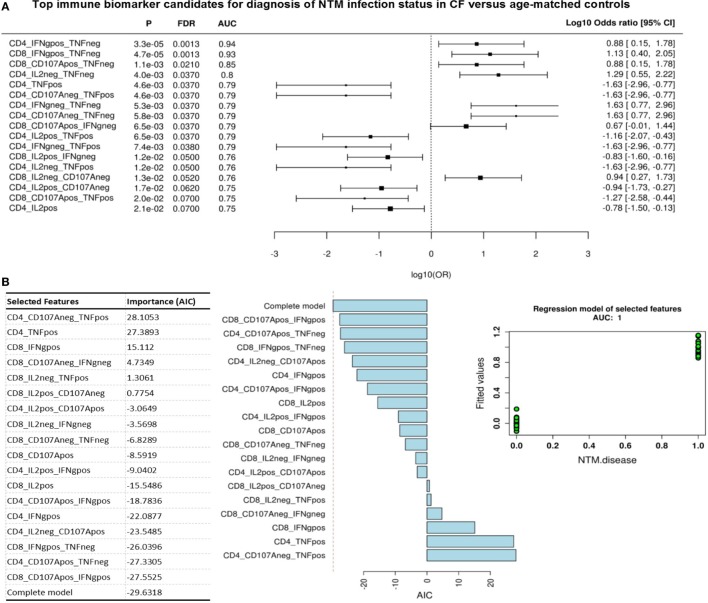
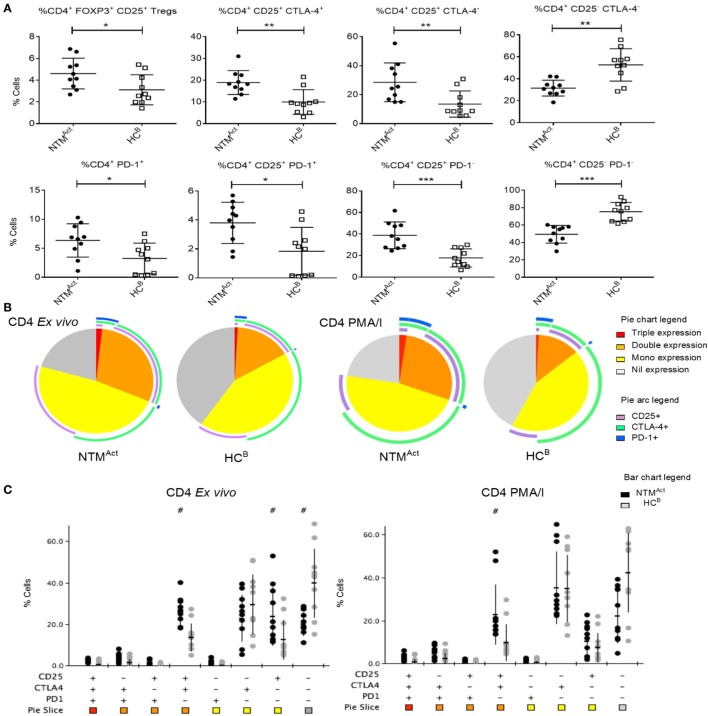
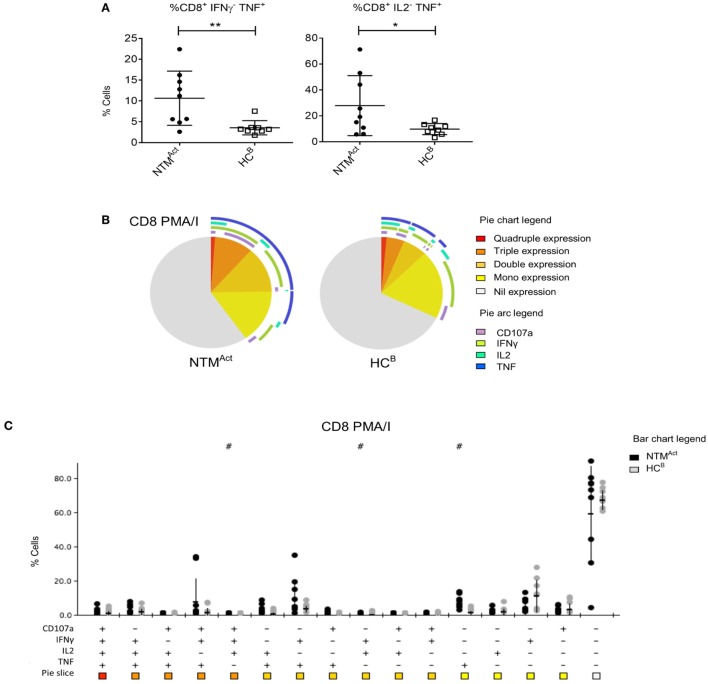
The increasing global incidence and prevalence of non-tuberculous mycobacteria (NTM) infection is of growing concern. New evidence of person-to-person transmission of multidrug-resistant NTM adds to the global concern. The reason why certain individuals are at risk of NTM infections is unknown. Using high definition flow cytometry, we studied the immune profiles of two groups that are at risk of Mycobacterium abscessus complex infection and matched controls. The first group was cystic fibrosis (CF) patients and the second group was elderly individuals. CF individuals with active M. abscessus complex infection or a history of M. abscessus complex infection exhibited a unique surface T cell phenotype with a marked global deficiency in TNFα production during mitogen stimulation. Importantly, immune-based signatures were identified that appeared to predict at baseline the subset of CF individuals who were at risk of M. abscessus complex infection. In contrast, elderly individuals with M. abscessus complex infection exhibited a separate T cell phenotype underlined by the presence of exhaustion markers and dysregulation in type 1 cytokine release during mitogen stimulation. Collectively, these data suggest an association between T cell signatures and individuals at risk of M. abscessus complex infection, however, validation of these immune anomalies as robust biomarkers will require analysis on larger patient cohorts.

Keywords: T cells; cystic fibrosis; immunoprofiling; non-tuberculous mycobacteria; pulmonary non-tuberculous mycobacteria infection.


Figures

Figure 1
Figure 1
Divergent T cell activation and exhaustion profiles in cystic fibrosis (CF) patients based on non-tuberculous mycobacteria (NTM) infection status. (A) Flow cytometric analysis of ex vivo CD4+ T cells show significant differences in Treg percentages and marker expression between patient groups. Significantly more Tregs were seen in both CFAct and CFPast groups compared to CFContro1 (one-way ANOVA with post-hoc testing P = 0.013 and P = 0.042, respectively). Significantly higher CD25+ CD4+ T cells were observed in both CFAct and CFPast groups compared to CFContro1 group (P = 0.0056 and P = 0.037, respectively). CD25 cytotoxic T-lymphocyte-associated protein 4 (CTLA-4) double-positive T cells were significantly higher in CFAct than in CFControl (P = 0.019). A reciprocal reduction in CD25 CTLA-4 double-negative CD4+ T cells were seen in CFAct, CFPast, and HCA groups compared to CFControl (P = 0.001, P = 0.027, and P = 0.008, respectively). CFAct patient with active Mycobacterium avium complex (MAC) infection is shown as a blue circle in scatter plots. This data point was not included in the ANOVA analysis but is shown here to demonstrate activation and exhaustion profile of a patient with an active NTM infection that is not MABS (B) Immune marker profiling of CD4+ T cells by SPICE showed differences in ex vivo phenotype in the CFContro1 group compared to CFAct (P = 0.0002), CFPast (P = 0.0002), and HCA (P = 0.005). PMA/I stimulation resulted in minor changes in maker profile with the CFControl profile still being significantly different to CFAct (P = 0.025) and CFPast(P > = 0.018) though the difference with HCAwas reduced (P = 0.057). (C) SPICE dot plots show expression levels of all combinations of markers CD25, CTLA-4, and programmed cell death protein 1 in CD4+ T cells both ex vivo and after PMA/I stimulation in CF patient and control groups. Groups with significantly different expression compared to HCA (Wilcoxon rank test P < 0.05) are indicated with # symbol. Symbol color indicates significantly different group.
Figure 2
Figure 2
Divergent T cell cytokine profiles in cystic fibrosis (CF) patients based on non-tuberculous mycobacteria (NTM) infection status. (A) Flow cytometric analysis of ex vivo activated CD4+ T cells show significantly lower IFNγ TNFα+ (P = 0.026 and P = 0.030) and CD107a TNFα+ (P = 0.026 and P = 0.027) T cells in CFAct and CFPast groups, respectively compared to the CFContro1 group. Differences were not significant when comparing the HCA group with ANOVA post-hoc testing. A similar pattern of increased TNFγ+ CD4+ T cells was seen in the HCA group. Significantly more IFNγ+ TNFα CD4+ T cells were seen in CFAct patients compared to CFContro1 patients (P = 0.0315) and significantly more IFNγ+ TNFα CD8+ T cells were seen in both CFAct and CFPast groups (P = 0.014 and P = 0.0047, respectively) compared to CFContro1 group. CFPast had significantly more IFNγ+ TNFα CD8+ T cells compared to HCA(P = 0.005). CFAct patient with active Mycobacterium avium complex infection is shown as a blue circle in scatter plots. This data point was not included in the ANOVA analysis but is shown here to demonstrate cytokine profile of a patient with an active NTM infection that is not MABS (B) Polyfunctionality profiling of CD4+ T cells by SPICE showed differences in ex vivo functions in CFAct and CFPast groups compared to CFControl (P = 0.056 and P = 0.041, respectively) and HCA groups (P = 0.022 and P = 0.012, respectively). TNFα mono-expressing CD4+ T cells (blue arc) were significantly lower in the two NTM patient groups compared to the CFContro1 and HCA groups. (C) SPICE dot plots show polyfunctionality profile of all combinations of cytokine expression in CD4+ T cells after PMA/I stimulation. Groups with significantly different expression compared to CFContro1 (Wilcoxon rank test P < 0.05) are indicated with # symbol. Symbol color indicates significantly different group.
Figure 3
Figure 3
Multivariate T cell analysis of mitogen-stimulated cytokine secretion profiles. (A) Unsupervised hierarchical clustering of mitogen-stimulated CD4+ and CD8+ T cell cytokine secretion profile show divergence based on non-tuberculous mycobacteria infection status. Each column represents an individual (patient/control) and each row represents a clustering variable (cytokine secretion pattern). Clustering patterns shown according to primary group [patient with cystic fibrosis (CF) black, or healthy control gray] and secondary group (CFAct-light green, CFPast-dark green, CFContro1-white, and HCA-black). Clustering of CFAc and CFPast patients with one exception and clustering of CFContro1 and HCA with one exception. (B) Principle component analysis (PCA) and canonical co-variate analysis (CCA) show significant clustering (P = 0.02) of subjects by patient group. Marked overlap between CFAct and CFPast groups is seen in terms of global cytokine secretion profile indicating an overall similarity in secretion profile. CFContro1 group diverges further from CFAct and CFPast groups.
Figure 4
Figure 4
Top immune biomarker candidates for diagnosis of non-tuberculous mycobacteria (NTM) infection status in cystic fibrosis cohorts. (A) Flow cytometric biomarkers for NTM disease state from cytokine secretion profile data (Wilcoxon rank test). Graph shows log odds ratio for each biomarker candidate for diagnosis of NTM disease state (negative versus exposed state) with 95% CI. (P, probability; FDR, false discover rate; AUC, area under the curve). (B) Stepwise regression model (forward selection) for NTM infection status. Fitted model contains 18 variables shown in table with a final AIC of −30 and an AUC 1. Plots show contribution of each variable to model and fitted value for each patient/control (green dots) when model is applied showing an AUC = 1.
Figure 5
Figure 5
Evidence of CD4+ T cell activation and exhaustion in immunocompetent individuals with active non-tuberculous mycobacteria (NTM) infection. (A) Flow cytometric analysis of ex vivo CD4+ T cells showed significantly more Tregs in NTMAct group compared to HCB group (P = 0.028). Significantly more CD25+ CTLA4+ and CD25+ CTLA4 CD4+ T cells were seen in NTMAct group (P = 0.002 and P = 0.009, respectively) compared to HCB. A reciprocal increase in CD25 CTLA4 CD4+ T cells was seen in the HCB group (P = 0.001) compared to disease group. Higher numbers of PD1+ CD4+ T cells (P = 0.021) and CD25+ PD1+ CD4+ T cells (P = 0.011) were seen in the NTMAct group. CD25+ PD1 T cells were significantly higher in NTMAct group (P < 0.001) and CD25 and PD1 CD4+ T cells were significantly higher in HCB group (P < 0.001). (B) Phenotyping and polyfunctionality profiling of CD4+ T cells by SPICE showed differences in NTMAct and HCB groups directly ex vivo and post PMA/I stimulation. Phenotype profiles were significantly different between groups both ex vivo (P = 0.0013) and post stimulation (P = 0.022). Significantly more CD25+ CTLA4+ T cells were observed in NTMAct groups compared to HCB. (C) SPICE dot plots show phenotype profile of all combinations of markers CD25, CTLA4, and PD1 in CD4+ T cells both ex vivo and post PMA/I stimulation between NTMAct and HCB groups. Significantly different expression compared to HCB (Wilcoxon rank test P < 0.05) is indicated with # symbol.
Figure 6
Figure 6
Divergence of CD8+ T cell cytokine profiles in immunocompetent individuals with active non-tuberculous mycobacteria (NTM) infection. (A) Flow cytometric analysis of ex vivo CD8+ T cells showed significantly more IFNγ TNFα+ cells (P = 0.01) and IL2 TNFα+ cells (P = 0.048) in NTMAct compared to HCB. (B) Polyfunctionality profiling of CD8+ T cells shown in pie charts were not significantly different between the two groups. However, significantly higher TNFα mono-functional CD8+ T cells were observed in NTM patient group (P = 0.002). (C) SPICE dot plots show polyfunctionality profile of all combinations of cytokine expression in CD8+ T cells after PMA/I stimulation between NTMAct and HCB groups. Significantly different expression compared to HCB (Wilcoxon rank test P < 0.05) is indicated with # symbol.

Similar articles

Cited by

References

    1. Morimoto K, Iwai K, Uchimura K, Okumura M, Yoshiyama T, Yoshimori K, et al. A steady increase in nontuberculous mycobacteriosis mortality and estimated prevalence in Japan. Ann Am Thorac Soc (2014) 11(1):1–8.10.1513/AnnalsATS.201303-067OC - DOI - PubMed
    1. Society TRCotBT. Pulmonary disease caused by Mycobacterium avium-intracellulare in HIV-negative patients: five-year follow-up of patients receiving standardised treatment. Int J Tuberc Lung Dis (2002) 6(7):628–34. - PubMed
    1. Andrejak C, Thomsen VO, Johansen IS, Riis A, Benfield TL, Duhaut P, et al. Nontuberculous pulmonary mycobacteriosis in Denmark: incidence and prognostic factors. Am J Respir Crit Care Med (2010) 181(5):514–21.10.1164/rccm.200905-0778OC - DOI - PubMed
    1. Fleshner M, Olivier KN, Shaw PA, Adjemian J, Strollo S, Claypool RJ, et al. Mortality among patients with pulmonary non-tuberculous mycobacteria disease. Int J Tuberc Lung Dis (2016) 20(5):582–7.10.5588/ijtld.15.0807 - DOI - PMC - PubMed
    1. Fangous MS, Mougari F, Gouriou S, Calvez E, Raskine L, Cambau E, et al. Classification algorithm for subspecies identification within the Mycobacterium abscessus species, based on matrix-assisted laser desorption ionization-time of flight mass spectrometry. J Clin Microbiol (2014) 52(9):3362–9.10.1128/JCM.00788-14 - DOI - PMC - PubMed

LinkOut - more resources