. 2018 Jun 11:6:8.
doi: 10.1186/s40170-018-0180-9. eCollection 2018.

Beta-hydroxybutyrate (3-OHB) can influence the energetic phenotype of breast cancer cells, but does not impact their proliferation and the response to chemotherapy or radiation

Affiliations

Beta-hydroxybutyrate (3-OHB) can influence the energetic phenotype of breast cancer cells, but does not impact their proliferation and the response to chemotherapy or radiation

Catharina Bartmann et al. Cancer Metab. .

Abstract

Background: Ketogenic diets (KDs) or short-term fasting are popular trends amongst supportive approaches for cancer patients. Beta-hydroxybutyrate (3-OHB) is the main physiological ketone body, whose concentration can reach plasma levels of 2-6 mM during KDs or fasting. The impact of 3-OHB on the biology of tumor cells described so far is contradictory. Therefore, we investigated the effect of a physiological concentration of 3 mM 3-OHB on metabolism, proliferation, and viability of breast cancer (BC) cells in vitro.

Methods: Seven different human BC cell lines (BT20, BT474, HBL100, MCF-7, MDA-MB 231, MDA-MB 468, and T47D) were cultured in medium with 5 mM glucose in the presence of 3 mM 3-OHB at mild hypoxia (5% oxygen) or normoxia (21% oxygen). Metabolic profiling was performed by quantification of the turnover of glucose, lactate, and 3-OHB and by Seahorse metabolic flux analysis. Expression of key enzymes of ketolysis as well as the main monocarboxylic acid transporter MCT2 and the glucose-transporter GLUT1 was analyzed by RT-qPCR and Western blotting. The effect of 3-OHB on short- and long-term cell proliferation as well as chemo- and radiosensitivity were also analyzed.

Results: 3-OHB significantly changed the oxygen consumption rate (OCR) and extracellular acidification rate (ECAR) in BT20 cells resulting in a more oxidative energetic phenotype. MCF-7 and MDA-MB 468 cells had increased ECAR only in response to 3-OHB, while the other three cell types remained uninfluenced. All cells expressed MCT2 and GLUT1, thus being able to uptake the metabolites. The consumption of 3-OHB was not strongly linked to mRNA overexpression of key enzymes of ketolysis and did not correlate with lactate production and glucose consumption. Neither 3-OHB nor acetoacetate did interfere with proliferation. Further, 3-OHB incubation did not modify the response of the tested BC cell lines to chemotherapy or radiation.

Conclusions: We found that a physiological level of 3-OHB can change the energetic profile of some BC cell lines. However, 3-OHB failed to influence different biologic processes in these cells, e.g., cell proliferation and the response to common breast cancer chemotherapy and radiotherapy. Thus, we have no evidence that 3-OHB generally influences the biology of breast cancer cells in vitro.

Keywords: Breast cancer; Chemotherapy; Ionizing radiation; Ketogenic diet; Ketone bodies; Metabolic profile; Seahorse; β-Hydroxybutyrate.


Conflict of interest statement

Not applicableThe authors declare that they have no competing interests.Springer Nature remains neutral with regard to jurisdictional claims in published maps and institutional affiliations.

Figures

Fig. 1
Fig. 1
The graphs represent the rate of lactate production (mmol × l−1 × optical density (OD)−1; upper panel) and glucose consumption (mmol × l−1 × OD−1; lower panel) normalized to total cell content (OD) after 5 days of culture in 5 or 21% oxygen (gray column = 3 mM 3-OHB; black column = control). Each column represents mean ± SEM of four independent experiments
Fig. 2
Fig. 2
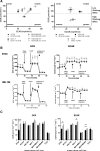
a Energetic phenotype as revealed by Seahorse flux analysis in cultures without 3-OHB (black symbols) and with 3 mM 3-OHB (gray symbols). Arrow indicates the significant (p < 0.05) shift in energetic phenotype observed with the BT20 cell line. Graph summarizes the results of four independent seahorse experiments with four replicate wells for each cell line. b The curves of OCR and ECAR for the BC cell lines with the most prominent changes (BT20) and without any changes (HBL100) depending on the addition of 3-OHB are shown here. The graph represents the three measuring points of basal levels of respiration/acidification, and changes after addition of oligomycin, FCCP, and antimycin A/rotenone (black line and dots = control, gray line and boxes = 3-OHB). c Column statistics of the baseline OCR and ECAR of BC cell lines with 3-OHB (gray column) compared to control (black column) (***p < 0.001; **p < 0.01; *p < 0.05). Each column summarizes mean ± SEM of four independent seahorse experiments with four replicate wells per experiment for each cell line
Fig. 3
Fig. 3
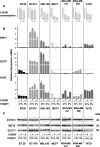
a The columns show the amount of 3-OHB (in mM) consumed by the cells normalized to their cell number as given by optical density (OD) measured with the crystal violet assay. Columns represent mean ± SEM of two independent experiments with three replicate wells per experiment. There was no significant difference in the consumption of 3-OHB between cultivation at 21 and 5% oxygen. A tendency to reduced 3-OHB consumption was observed at 5% oxygen. b Relative expression of mRNA for the ketolytic enzymes BDH1 (β-hydroxybutyrate dehydrogenase), SCOT (succinyl-CoA:3-ketoacid coenzyme A transferase), and ACAT (acetyl-CoA acetyltransferases) in the tested BC cell lines. Each column represents mean ± SEM of data from two independent cell culture experiments in triplicate reactions for each primer pair. c All cell lines express the most important transporter for 3-OHB, the monocarboxylate transporter 2 (MCT2), and the glucose transporter 1 (GLUT1) on protein level. Beta-actin served as loading control. Representative Western blot images of the four test conditions (21 and 5% oxygen with and without 3-OHB) for each cell line are shown
Fig. 4
Fig. 4
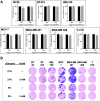
a The graphs show the proliferation rate (BrdU; in % of control cells) of the different BC cell lines cultured in medium containing 3 mM 3-OHB (gray column) compared to control without 3-OHB (black column) at 5 or 21% oxygen concentration after 5 days of culture (differences are not statistically significant). The columns summarize mean ± SEM of data of four independent experiments with three replicate wells per experiment for each cell line. b The figure shows representative results (one out of eight replicates for each cell line) of the colony formation assay for the tested BC cell lines after 14 days of culture. The cell lines show no significant alteration in number and size of colonies upon addition of 3-OHB. BT474, HBL-100, and MDA-MB 231 showed an overall reduced colony size at 5% oxygen concentration compared to 21% oxygen concentration
Fig. 5
Fig. 5
a The column-graphs show the cumulative IC50 of epirubicin, paclitaxel, and carboplatin in control cells (dark gray box) and cells cultured with 3 mM 3-OHB (light gray box). Per cell line, three to four each independent dose-response experiments with six replicate wells per experiment were calculated. b Representative dose-response curves obtained for BT-20 cells at 5% oxygen in chemotherapy sensitivity testing with the chemotherapeutic drugs (epirubicin, paclitaxel, carboplatin) which was used for the calculation of the IC50 (dashed line) (black box = control, white box = 3-OHB). c Same as b but for 21% oxygen. Curves summarize four independent experiments with six replicate wells per experiment
Fig. 6
Fig. 6
Cell proliferation after irradiation measured by BrdU, summarized for all BC cell lines at 21% (a) and 5% (b) oxygen concentration (black column = control; gray column = 3 mM 3-OHB). No significant influence of 3-OHB was seen. Columns represent mean ± SEM of three independent experiments with six replicate wells per experiment. Two representative dose-response curves for MCF7 and MDA-MB 468 are shown (cf). MDA-MB 468 cells were sensitive to radiation (c, d), while MCF7 cells were relatively insensitive even to high doses (e, f). Open and filled symbols represent mean (± SD) of S-phase cell counts in 3-OHB-untreated control and 3-OHB-treated cells, respectively. The data were normalized to the corresponding values of non-irradiated cells at 21 or 5% oxygen, respectively

References

    1. DeSantis CE, Fedewa SA, Goding Sauer A, Kramer JL, Smith RA, Jemal A. Breast cancer statistics, 2015: convergence of incidence rates between black and white women. CA Cancer J Clin. 2016;66:31–42. doi: 10.3322/caac.21320. - DOI - PubMed
    1. Gnant M, Thomssen C, Harbeck N. St. Gallen/Vienna 2015: a brief summary of the consensus discussion. Breast Care (Basel) 2015;10:124–130. doi: 10.1159/000430488. - DOI - PMC - PubMed
    1. Huang J, Pan G, Jiang H, Li W, Dong J, Zhang H, Ji X, Zhu Z. A meta-analysis between dietary carbohydrate intake and colorectal cancer risk: evidence from 17 observational studies. Biosci Rep. 2017;37 - PMC - PubMed
    1. Ye Y, Wu Y, Xu J, Ding K, Shan X, Xia D. Association between dietary carbohydrate intake, glycemic index and glycemic load, and risk of gastric cancer. Eur J Nutr. 2017;56:1169–1177. doi: 10.1007/s00394-016-1166-4. - DOI - PubMed
    1. van den Brandt PA, Schulpen M. Mediterranean diet adherence and risk of postmenopausal breast cancer: results of a cohort study and meta-analysis. Int J Cancer. 2017;140:2220–2231. doi: 10.1002/ijc.30654. - DOI - PubMed

LinkOut - more resources