

A retrospective cohort study to compare post-injury admissions for infectious diseases in burn patients, non-burn trauma patients and uninjured people
- PMID: 29942812
- PMCID: PMC5996559
- DOI: 10.1186/s41038-018-0120-5
A retrospective cohort study to compare post-injury admissions for infectious diseases in burn patients, non-burn trauma patients and uninjured people
Abstract
Background: Injury triggers a range of systemic effects including inflammation and immune responses. This study aimed to compare infectious disease admissions after burn and other types of injury using linked hospital admissions data.
Methods: A retrospective longitudinal study using linked health data of all patients admitted with burns in Western Australia (n = 30,997), 1980-2012, and age and gender frequency matched cohorts of people with non-burn trauma (n = 28,647) and no injury admissions (n = 123,399). Analyses included direct standardisation, negative binomial regression and Cox proportional hazards regression.
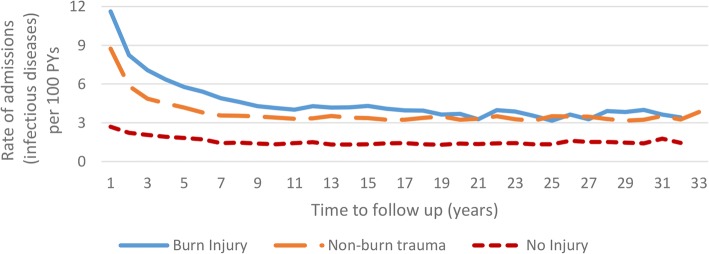
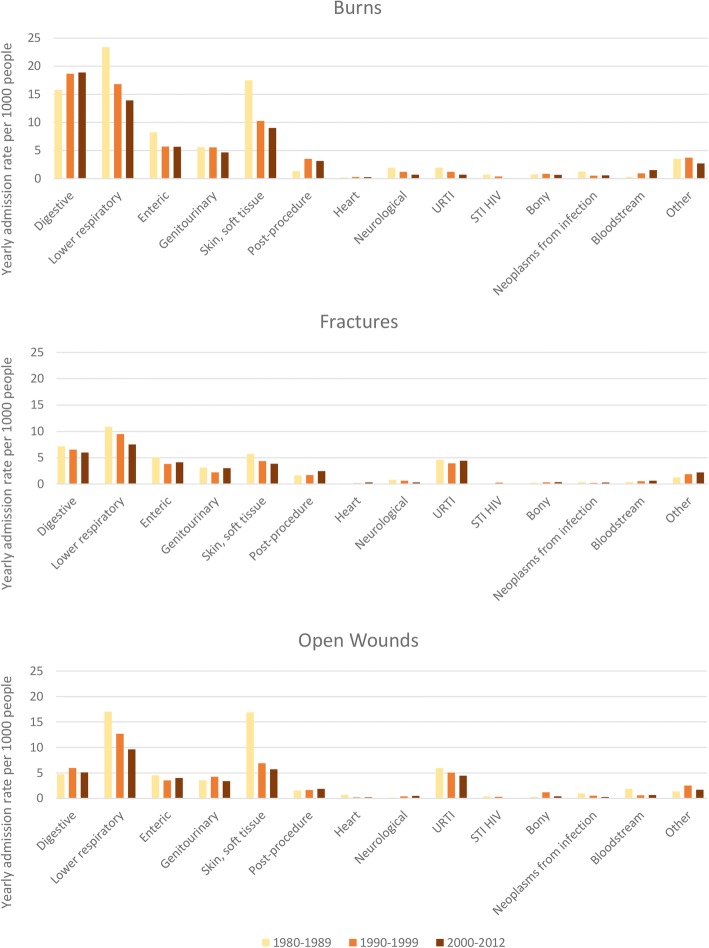
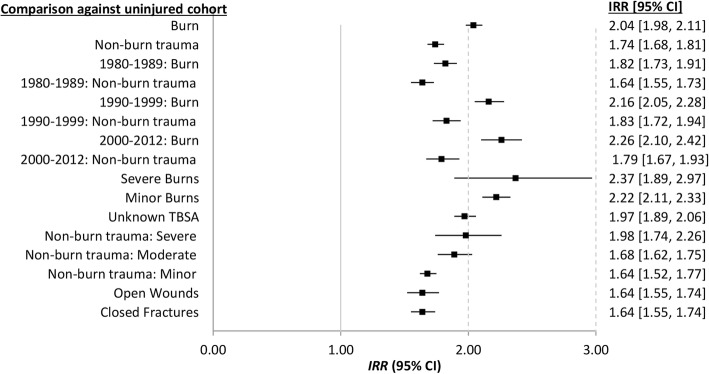
Results: Annual age-standardised infectious disease admission rates were highest for the burn cohort, followed by the non-burn trauma and uninjured cohorts. Age-standardised admission rates by decade showed different patterns across major categories of infectious diseases, with the lower respiratory and skin and soft tissue infections the most common for those with burns and other open trauma. Compared with the uninjured, those with burns had twice the admission rate for infectious disease after discharge (incident rate ratio (IRR), 95% confidence interval (CI): 2.04, 1.98-2.11) while non-burn trauma experienced 1.74 times higher rates (95%CI: 1.68-1.81). The burn cohort experienced 10% higher rates of first-time admissions after discharge when compared with the non-burn trauma (hazard ratio (HR), 95%CI: 1.10, 1.05-1.15). Compared with the uninjured cohort, incident admissions were highest during the first 30 days after discharge for burns (HR, 95%CI: 5.18, 4.15-6.48) and non-burn trauma (HR, 95%CI: 5.06, 4.03-6.34). While incident rates remained high over the study period, the magnitude decreased with increasing time from discharge: burn vs uninjured: HR, 95%CI: 30 days to 1 year: 1.69, 1.53-1.87; 1 to 10 years: 1.40, 1.33-1.47; 10 years to end of study period: 1.16, 1.08-1.24; non-burn trauma vs uninjured: HR, 95%CI: 30 days to 1 year: 1.71, 1.55-1.90; 1 to 10 years: 1.30, 1.24-1.37; 10 years to end of study period: 1.09, 1.03-1.17).
Conclusions: Burns and non-burn trauma patients had higher admission rates for infectious diseases compared with age and gender matched uninjured people. The pattern of annual admission rates for major categories of infectious diseases varied across injury groups. Overall, the burn cohort experienced the highest rates for digestive, lower respiratory and skin and soft tissue infections. These results suggest long-term vulnerability to infectious disease after injury, possibly related to long-term immune dysfunction.
Keywords: Burn; Cohort; Infectious diseases; No injury; Non-burn trauma; Population-based.
Conflict of interest statement
Approval was granted by the Human Research Ethics Committees’ of the Western Australian Department of Health and the University of Western Australia.The authors declare that they have no competing interests.
Figures


References
-
- Haagsma JA, Graetz N, Bolliger I, Naghavi M, Higashi H, Mullany EC, et al. The global burden of injury: incidence, mortality, disability-adjusted life years and time trends from the Global Burden of Disease study 2013. Inj Prev. 2016;22:3–18. doi: 10.1136/injuryprev-2015-041616. - DOI - PMC - PubMed
LinkOut - more resources
Full Text Sources
Other Literature Sources
