

Comparison between software volumetric breast density estimates in breast tomosynthesis and digital mammography images in a large public screening cohort
- PMID: 29943180
- PMCID: PMC6291428
- DOI: 10.1007/s00330-018-5582-0
Comparison between software volumetric breast density estimates in breast tomosynthesis and digital mammography images in a large public screening cohort
Abstract
Objectives: To compare software estimates of volumetric breast density (VBD) based on breast tomosynthesis (BT) projections to those based on digital mammography (DM) images in a large screening cohort, the Malmö Breast Tomosynthesis Screening Trial (MBTST).
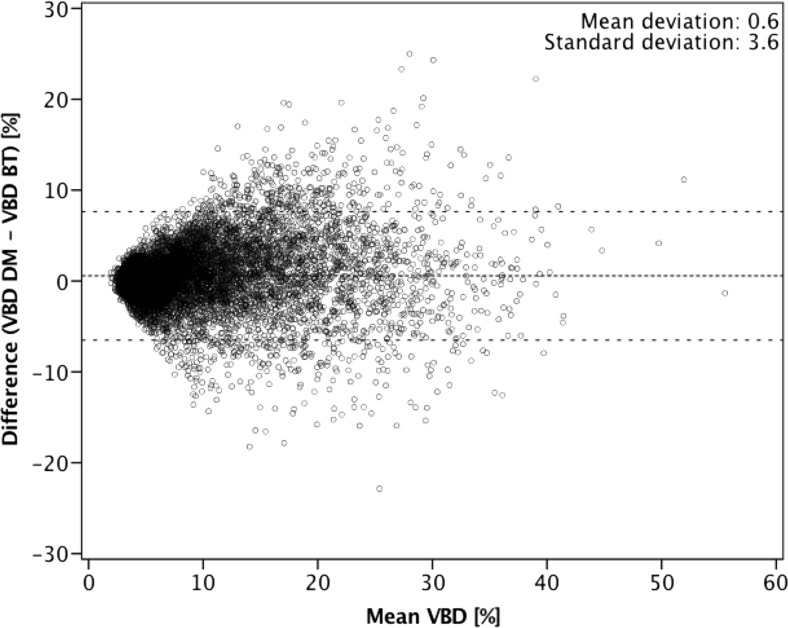
Methods: DM and BT images of 9909 women (enrolled 2010-2015) were retrospectively analysed with prototype software to estimate VBD. Software calculation is based on a physics model of the image acquisition process and incorporates the effect of masking in DM based on accumulated dense tissue areas. VBD (continuously and categorically) was compared between BT [central projection (mediolateral oblique view (MLO)] and two-view DM, and with radiologists' BI-RADS density 4th ed. scores. Agreement and correlation were investigated with weighted kappa (κ), Spearman's correlation coefficient (r), and Bland-Altman analysis.
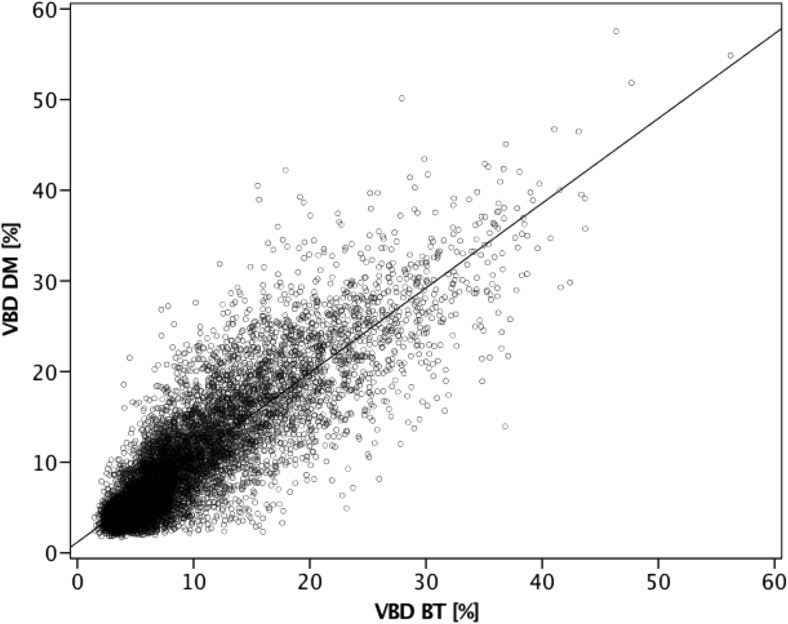
Results: There was a high correlation (r = 0.83) between VBD in DM and BT and substantial agreement between the software breast density categories [observed agreement, 61.3% and 84.8%; κ = 0.61 and ĸ = 0.69 for four (a/b/c/d) and two (fat involuted vs. dense) density categories, respectively]. There was moderate agreement between radiologists' BI-RADS scores and software density categories in DM (ĸ = 0.55) and BT (ĸ = 0.47).
Conclusions: In a large public screening setting, we report a substantial agreement between VBD in DM and BT using software with special focus on masking effect. This automated and objective mode of measuring VBD may be of value to radiologists and women when BT is used as the primary breast cancer screening modality.
Key points: • There was a high correlation between continuous volumetric breast density in DM and BT. • There was substantial agreement between software breast density categories (four groups) in DM and BT; with clinically warranted binary software breast density categories, the agreement increased markedly. • There was moderate agreement between radiologists' BI-RADS scores and software breast density categories in DM and BT.
Keywords: Breast neoplasms; Diagnostic imaging; Digital breast tomosynthesis; Mammography; Mass screening.
Conflict of interest statement
Guarantor
The scientific guarantor of this publication is Hanna Sartor, MD PHD.
Conflict of interest
The authors of this manuscript declare relationships with the following companies:
Siemens Healthcare
Siemens has provided us with the mammography/tomosynthesis equipment and VBD software prototype. The sponsors (Siemens) of the study had no role in the design and performance of the study, data analyses, or data interpretation. One of the co-authors, AF PhD, Siemens Healthcare, has provided expertise on the software prototype. HS and KL have received speaker’s fees and travel grants for talking at Siemens seminars.
Statistics and biometry
No complex statistical methods were necessary for this paper.
Informed consent
Written informed consent was obtained from all subjects (patients) in this study.
Ethical approval
Institutional review board approval was obtained.
Study subjects or cohorts overlap
Some study subjects or cohorts have been previously reported in:
1. Lang K, Andersson I, Rosso A, Tingberg A, Timberg P, Zackrisson S. Performance of one-view breast tomosynthesis as a stand-alone breast cancer screening modality: results from the Malmo Breast Tomosynthesis Screening Trial, a population-based study. European radiology. 2016;26(1):184–90.
2. Timberg P, Fieselmann A, Dustler M, Petersson H, Sartor H, Lång K, Zackrisson S. Breast density assessment using breast tomosynthesis images. In: Tingberg A, ed. International Workshop of Digital Mammography (IWDM) 2016. Switzerland: Springer International Publishing, 2016; p. 197–202.
3. Rosso A, Lang K, Petersson IF, Zackrisson S. Factors affecting recall rate and false positive fraction in breast cancer screening with breast tomosynthesis - A statistical approach. Breast. 2015;24(5):680–6.
4. Sartor H, Lang K, Rosso A, Borgquist S, Zackrisson S, Timberg P. Measuring mammographic density: comparing a fully automated volumetric assessment versus European radiologists’ qualitative classification. European radiology 2016;26:4354–4360.
5. Lang K, Nergarden M, Andersson I, Rosso A, Zackrisson S. False positives in breast cancer screening with one-view breast tomosynthesis: An analysis of findings leading to recall, work-up and biopsy rates in the Malmo Breast Tomosynthesis Screening Trial. European radiology. 2016;26(11):3899–907.
Methodology
• retrospective
• diagnostic or prognostic study
• performed at one institution
Figures
Similar articles
-
Measuring mammographic density: comparing a fully automated volumetric assessment versus European radiologists' qualitative classification.Eur Radiol. 2016 Dec;26(12):4354-4360. doi: 10.1007/s00330-016-4309-3. Epub 2016 Mar 24. Eur Radiol. 2016. PMID: 27011371 Free PMC article. Clinical Trial.
-
Breast Density Estimation with Fully Automated Volumetric Method: Comparison to Radiologists' Assessment by BI-RADS Categories.Acad Radiol. 2016 Jan;23(1):78-83. doi: 10.1016/j.acra.2015.09.012. Epub 2015 Oct 27. Acad Radiol. 2016. PMID: 26521687
-
False positives in breast cancer screening with one-view breast tomosynthesis: An analysis of findings leading to recall, work-up and biopsy rates in the Malmö Breast Tomosynthesis Screening Trial.Eur Radiol. 2016 Nov;26(11):3899-3907. doi: 10.1007/s00330-016-4265-y. Epub 2016 Mar 4. Eur Radiol. 2016. PMID: 26943342 Free PMC article. Clinical Trial.
-
Vision 20/20: Mammographic breast density and its clinical applications.Med Phys. 2015 Dec;42(12):7059-77. doi: 10.1118/1.4935141. Med Phys. 2015. PMID: 26632060 Review.
-
Molecular Breast Imaging in the Screening Setting.J Breast Imaging. 2023 May 22;5(3):240-247. doi: 10.1093/jbi/wbad011. J Breast Imaging. 2023. PMID: 38416886 Review.
Cited by
-
Fully Automated Volumetric Breast Density Estimation from Digital Breast Tomosynthesis.Radiology. 2021 Dec;301(3):561-568. doi: 10.1148/radiol.2021210190. Epub 2021 Sep 14. Radiology. 2021. PMID: 34519572 Free PMC article.
-
Artificial Intelligence Detection of Missed Cancers at Digital Mammography That Were Detected at Digital Breast Tomosynthesis.Radiol Artif Intell. 2021 Sep 1;3(6):e200299. doi: 10.1148/ryai.2021200299. eCollection 2021 Nov. Radiol Artif Intell. 2021. PMID: 34870215 Free PMC article.
-
Volumetric breast density measurement for personalized screening: accuracy, reproducibility, consistency, and agreement with visual assessment.J Med Imaging (Bellingham). 2019 Jul;6(3):031406. doi: 10.1117/1.JMI.6.3.031406. Epub 2019 Feb 5. J Med Imaging (Bellingham). 2019. PMID: 30746394 Free PMC article.
-
Cancers not detected in one-view breast tomosynthesis screening-characteristics and reasons for non-detection.Eur Radiol. 2025 Jul;35(7):3951-3960. doi: 10.1007/s00330-024-11278-2. Epub 2024 Dec 20. Eur Radiol. 2025. PMID: 39706921 Free PMC article.
-
A Multisite Study of a Breast Density Deep Learning Model for Full-Field Digital Mammography and Synthetic Mammography.Radiol Artif Intell. 2020 Nov 4;3(1):e200015. doi: 10.1148/ryai.2020200015. eCollection 2021 Jan. Radiol Artif Intell. 2020. PMID: 33937850 Free PMC article.
References
-
- Hofvind S, Hovda T, Holen ÅS et al. Digital breast tomosynthesis and synthetic 2D mammography versus digital mammography: evaluation in a population-based screening program. Radiology 287(3):787–794 - PubMed
-
- Lang K, Andersson I, Rosso A, Tingberg A, Timberg P, Zackrisson S. Performance of one-view breast tomosynthesis as a stand-alone breast cancer screening modality: results from the Malmo Breast Tomosynthesis Screening Trial, a population-based study. Eur Radiol. 2016;26:184–190. doi: 10.1007/s00330-015-3803-3. - DOI - PMC - PubMed
-
- Skaane P, Sebuodegard S, Bandos AI et al (2018) Performance of breast cancer screening using digital breast tomosynthesis: results from the prospective population-based Oslo Tomosynthesis Screening Trial. Breast Cancer Res Treat. 10.1007/s10549-018-4705-2 - PubMed
Publication types
MeSH terms
LinkOut - more resources
Full Text Sources
Other Literature Sources
Medical
