Quantification of placental change in mouse models of preeclampsia using magnetic resonance microscopy
- PMID: 29943952
- PMCID: PMC6038111
- DOI: 10.4081/ejh.2018.2868
Quantification of placental change in mouse models of preeclampsia using magnetic resonance microscopy
Abstract
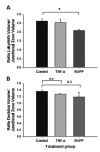
Abnormal development of the placenta is postulated to be central to the aetiology of preeclampsia. This study investigates changes in placental histopathology in mouse models of preeclampsia compared to the morphology using magnetic resonance microscopy (MRM) (11.7 T) of intact ex vivo tissue followed by 3D analysis of the image data. Here, C57BL/6JArc pregnant mice were subject to either normal pregnancy (n=3), or to one of two experimental models of preeclampsia; TNF-α infusion (n=3) or reduced uterine perfusion pressure(RUPP) (n=3). Placental tissue was collected at gestational day (gd) 17, fixed in formalin and incubated with Magnavist™ contrast agent, and high resolution images (50 μm × 50 μm × 50 μm voxels) obtained by magnetic resonance imaging at 11.74 T. Visual segmentation into placental subregions and three dimensional (3D) reconstruction followed by volume analysis was performed with Amira™ 3D analysis software. The significance of differences between treatment groups in total and regional volumes was assessed. In a single placenta the volumes measure by standard histology were compared. Three placentas from each animal were imaged, segmented into anatomical regions and 3D reconstructions generated. Total placental volume, labyrinth and decidual volume were not significantly different between groups. The junctional zone volume was found to be significantly larger in the RUPP animals (18.5±1.5 mm3) compared to TNF-α infused animals (15.8±1.5) or control animals (15.0±0.7, P<0.01). However, the decidual/junctional zone volume was smaller in the TNF-a compared to control animals (P<0.05). Placental structural change in experimental models of preeclampsia is able to be visualized and quantified using MRM and 3-D analysis. These techniques could prove to be a powerful tool in examining changes in placental morphology.
Keywords: 3-D reconstruction.; MRI; Magnetic Resonance Microscopy; Placental volume; preeclampsia.
Figures


Similar articles
-
OS044. Morphological differences in murine placenta detected by magneticresonance imaging measurements of T2 relaxation times in mouse models ofpreeclampsia.Pregnancy Hypertens. 2012 Jul;2(3):200-1. doi: 10.1016/j.preghy.2012.04.045. Epub 2012 Jun 13. Pregnancy Hypertens. 2012. PMID: 26105258
-
Assessment of feto-placental oxygenation and perfusion in a rat model of placental insufficiency using T2* mapping and 3D dynamic contrast-enhanced MRI.Placenta. 2024 Jun;151:19-25. doi: 10.1016/j.placenta.2024.04.008. Epub 2024 Apr 17. Placenta. 2024. PMID: 38657321
-
Assessment of Placental Perfusion in the Preeclampsia L-NAME Rat Model with High-Field Dynamic Contrast-Enhanced MRI.Fetal Diagn Ther. 2018;44(4):277-284. doi: 10.1159/000484314. Epub 2018 Apr 24. Fetal Diagn Ther. 2018. PMID: 29689556
-
Dynamic contrast enhanced magnetic resonance imaging: A review of its application in the assessment of placental function.Placenta. 2021 Oct;114:90-99. doi: 10.1016/j.placenta.2021.08.055. Epub 2021 Aug 24. Placenta. 2021. PMID: 34507031 Review.
-
[Placental functional assessment using MRI: mice today, humans tomorrow?].J Gynecol Obstet Biol Reprod (Paris). 2005 Nov;34(7 Pt 1):666-73. doi: 10.1016/s0368-2315(05)82899-6. J Gynecol Obstet Biol Reprod (Paris). 2005. PMID: 16270004 Review. French.
Cited by
-
Twenty years of histochemistry in the third millennium, browsing the scientific literature.Eur J Histochem. 2020 Dec 29;64(4):3213. doi: 10.4081/ejh.2020.3213. Eur J Histochem. 2020. PMID: 33478199 Free PMC article.
-
Maternal and Fetal-Placental Effects of Etanercept Treatment During Rats' Pregnancy.Front Physiol. 2022 Feb 3;12:787369. doi: 10.3389/fphys.2021.787369. eCollection 2021. Front Physiol. 2022. PMID: 35185598 Free PMC article.
-
Histochemistry as a versatile research toolkit in biological research, not only an applied discipline in pathology.Eur J Histochem. 2018 Dec 21;62(4):3006. doi: 10.4081/ejh.2018.3006. Eur J Histochem. 2018. PMID: 30572698 Free PMC article.
-
Maternal exercise rescues fetal akinesia-impaired joint and bone development.bioRxiv [Preprint]. 2025 Jun 17:2025.06.17.660083. doi: 10.1101/2025.06.17.660083. bioRxiv. 2025. PMID: 40667119 Free PMC article. Preprint.
-
Impact of antiphospholipid syndrome on placenta and uterine NK cell function: insights from a mouse model.Sci Rep. 2024 Dec 28;14(1):31163. doi: 10.1038/s41598-024-82451-2. Sci Rep. 2024. PMID: 39732740 Free PMC article.
References
-
- McMaster MT, Zhou Y, Fisher SJ. Abnormal placentation and the syndrome of preeclampsia. Semin Nephrol 2004;24:540-7. - PubMed
-
- Roberts JM, Gammill HS. Preeclampsia: recent insights. Hypertension 2005;46:1243-9. - PubMed
-
- Champion H, Innes BA, Robson SC, Lash GE, Bulmer JN. Effects of interleukin- 6 on extravillous trophoblast invasion in early human pregnancy. Mol Hum Reprod 2012;18:391-400. - PubMed
MeSH terms
LinkOut - more resources
Full Text Sources
Other Literature Sources
Medical

