Distribution of non-myelinating Schwann cells and their associations with leukocytes in mouse spleen revealed by immunofluorescence staining
- PMID: 29943953
- PMCID: PMC6038114
- DOI: 10.4081/ejh.2018.2890
Distribution of non-myelinating Schwann cells and their associations with leukocytes in mouse spleen revealed by immunofluorescence staining
Abstract
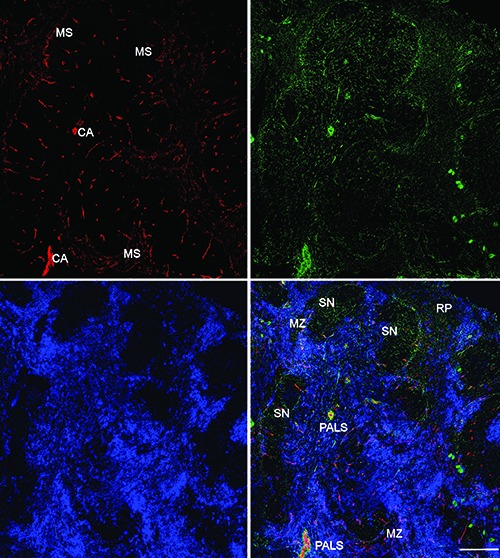
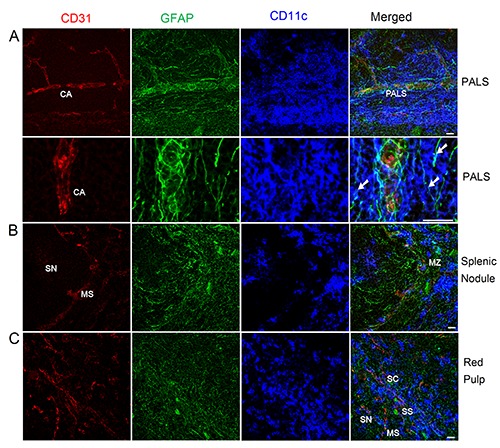
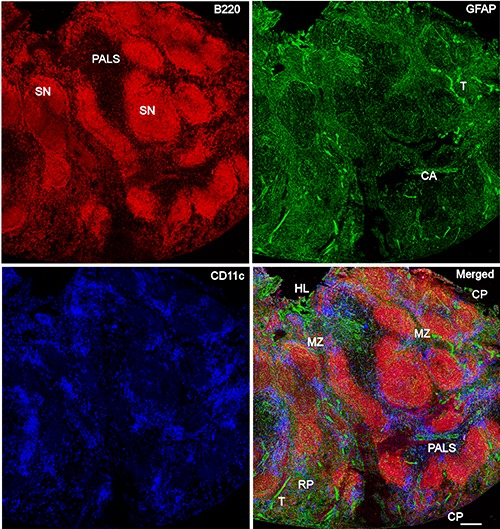
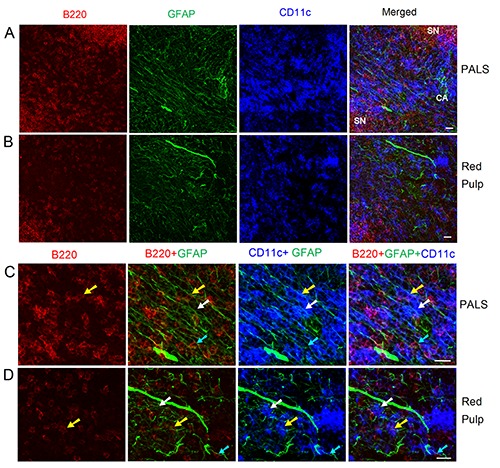
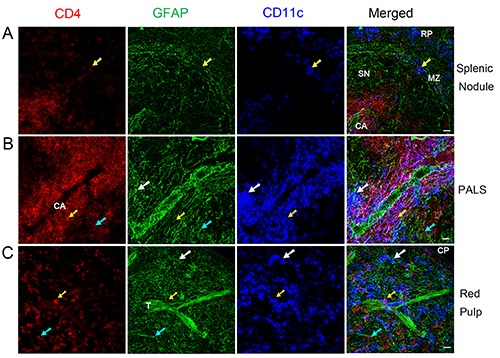
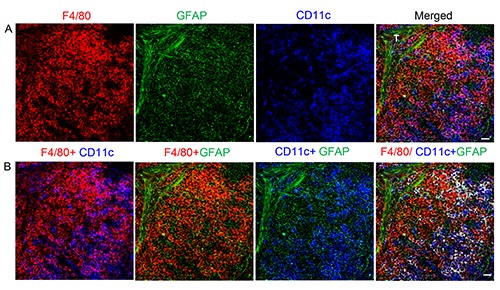
The nervous system and the immune system communicate extensively with each other in order to maintain homeostasis and to regulate the immune response. The peripheral nervous system (PNS) communicates specifically with the immune system according to local interactions, including the "hardwiring" of sympathetic/parasympathetic (efferent) and sensory nerves (afferent) to lymphoid tissue and organs. To reveal this type of bidirectional neuroimmune interaction at the microscopic level, we used immunofluorescent staining of glial fibrillary acidic protein (GFAP) coupled with confocal microscopy/3D reconstruction to reveal the distribution of non-myelinating Schwann cells (NMSCs) and their interactions with immune cells inside mouse spleen. Our results demonstrate i) the presence of an extensive network of NMSC processes in all splenic compartments including the splenic nodules, periarteriolar lymphoid sheath (PALS), marginal zone, trabecula, and red pulp; ii) the close association of NMSC processes with blood vessels (including central artries and their branches, marginal sinuses, penicillar arterioles and splenic sinuses); iii) the close "synapse-like" interaction/association of NMSC processes with various subsets of dendritic cells (DCs; e.g., CD4+CD11c+ DCs, B220+CD11c+ DCs, and F4/80+ CD11c+ DCs), macrophages (F4/80+), and lymphocytes (B cells, CD4+ T helper cells). Our novel findings concerning the distribution of NMSCs and NMSC-leukocytes interactions inside mouse spleen should improve our understanding of the mechanisms through which the PNS affects cellular- and humoral-mediated immune responses in a variety of health conditions and infectious/non-infectious diseases.
Keywords: Non-myelinating Schwann cells (NMSC); dendritic cell (DC); immunofluorescence staining.; lymphocyte; spleen.
Conflict of interest statement
Conflict of interest: None of the authors has a conflict of interest to declare.
Figures
Similar articles
-
Immunofluorescent Localization of Non-myelinating Schwann Cells and Their Interactions With Immune Cells in Mouse Thymus.J Histochem Cytochem. 2018 Nov;66(11):775-785. doi: 10.1369/0022155418778543. Epub 2018 May 18. J Histochem Cytochem. 2018. PMID: 29775115 Free PMC article.
-
Immunofluorescent characterization of non-myelinating Schwann cells and their interactions with immune cells in mouse mesenteric lymph node.Eur J Histochem. 2017 Aug 7;61(3):2827. doi: 10.4081/ejh.2017.2827. Eur J Histochem. 2017. PMID: 29046050 Free PMC article.
-
Distribution of nerve fibers and nerve-immune cell association in mouse spleen revealed by immunofluorescent staining.Sci Rep. 2020 Jun 17;10(1):9850. doi: 10.1038/s41598-020-66619-0. Sci Rep. 2020. PMID: 32555231 Free PMC article.
-
Human spleen microanatomy: why mice do not suffice.Immunology. 2015 Jul;145(3):334-46. doi: 10.1111/imm.12469. Immunology. 2015. PMID: 25827019 Free PMC article. Review.
-
Bidirectional crosstalk between the peripheral nervous system and lymphoid tissues/organs.Front Immunol. 2023 Sep 12;14:1254054. doi: 10.3389/fimmu.2023.1254054. eCollection 2023. Front Immunol. 2023. PMID: 37767094 Free PMC article. Review.
Cited by
-
A journal of histochemistry as a forum for non-histochemical scientific societies.Eur J Histochem. 2019 Dec 23;63(4):3106. doi: 10.4081/ejh.2019.3106. Eur J Histochem. 2019. PMID: 31868322 Free PMC article.
-
Innervation and nerve-immune cell contacts in mouse Peyer's patches.Histol Histopathol. 2020 Apr;35(4):371-383. doi: 10.14670/HH-18-158. Epub 2019 Sep 5. Histol Histopathol. 2020. PMID: 31486062
-
Transcriptomic Profiling of Influenza A Virus-Infected Mouse Lung at Recovery Stage Using RNA Sequencing.Viruses. 2023 Oct 31;15(11):2198. doi: 10.3390/v15112198. Viruses. 2023. PMID: 38005876 Free PMC article.
-
Histochemistry as a versatile research toolkit in biological research, not only an applied discipline in pathology.Eur J Histochem. 2018 Dec 21;62(4):3006. doi: 10.4081/ejh.2018.3006. Eur J Histochem. 2018. PMID: 30572698 Free PMC article.
-
Single Cell Transcriptomics Identifies Distinct Choroid Cell Populations Involved in Visually Guided Eye Growth.Front Ophthalmol (Lausanne). 2023;3:1245891. doi: 10.3389/fopht.2023.1245891. Epub 2023 Oct 6. Front Ophthalmol (Lausanne). 2023. PMID: 38390290 Free PMC article.
References
MeSH terms
Substances
LinkOut - more resources
Full Text Sources
Other Literature Sources
Research Materials
Miscellaneous