. 2018 Jul 30;9(3):e0021.
doi: 10.5041/RMMJ.10336.

Challenging the Cinderella Hypothesis: A New Model for the Role of the Motor Unit Recruitment Pattern in the Pathogenesis of Myofascial Pain Syndrome in Postural Muscles

Affiliations

Challenging the Cinderella Hypothesis: A New Model for the Role of the Motor Unit Recruitment Pattern in the Pathogenesis of Myofascial Pain Syndrome in Postural Muscles

Amir Minerbi et al. Rambam Maimonides Med J. .

Abstract

Background: The energy crisis hypothesis, which is a widely accepted model for the pathogenesis of myofascial pain, has been corroborated by experimental observations. However, the nature of the insult leading to the energy crisis remains elusive. A commonly cited model for this insult is the Cinderella hypothesis, suggesting that hierarchical recruitment of motor units leads to a disproportional load on small units, thus driving them towards an energy crisis. New findings cast doubt on this model, showing that in postural muscles motor units are recruited in rotation, rather than in a hierarchical order, precluding the formation of the so-called Cinderella units.

Objective: To explore the influence of common myofascial predisposing factors such as muscle load and muscle strength on the relaxation time of postural muscle motor units, assuming they are recruited in rotation.

Methods: A stochastic model of a postural skeletal muscle was developed which integrates the energy crisis model and motor unit rotation patterns observed in postural muscles. Postulating that adequate relaxation time is essential for the energetic replenishment of motor units, we explored the influence of different parameters on the relaxation time of individual motor units under varying conditions of muscle loads and muscle strengths.

Results: The motor unit relaxation/contraction time ratio decreases with elevated muscle loads and with decreased total muscle strength.

Conclusions: In a model of a postural muscle, in which motor units are recruited in rotation, common predisposing factors of myofascial pain, such as increased muscle load and decreased muscle force, lead to shortened motor unit relaxation periods.


Conflict of interest statement

Conflict of interest: No potential conflict of interest relevant to this article was reported.

Figures

Figure 1
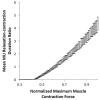
Figure 1. The Effect of Muscle Load on Average Motor Unit Relative Relaxation Time
The figure represents the results of multiple simulated loadings of a single phasic muscle, with increasing loads, whose sizes are represented here as a fraction of the muscle’s maximum loading capacity (x-axis). Relative MU relaxation time, calculated as mean relaxation time/mean contraction time, is represented in the y-axis. Mean of 100 simulations, bars represent standard deviation. (MU, motor units).
Figure 2
Figure 2. The Effect of Maximum Muscle Strength on the Average Motor Unit Relative Relaxation Time
In this simulation, muscles of different maximum strength were loaded with a constant load, weighing 20% of the maximum muscle strength of the muscle presented in Figure 1. A mean MU relaxation/contraction duration ratio of 0 means that units are constantly contracted and the relaxation time equals 0. Mean of 100 simulations, bars represent standard deviation. (MU, motor unit).
Figure 3
Figure 3. The Effect of Muscle Load on Average Motor Unit Relaxation Time (A) and the Effect of Muscle Strength on Average Motor Unit Relaxation Time (B)
Uniform probability of recruitment distribution (blue); and small motor unit biased recruitment probability distribution (red). Note that the two curves are qualitatively similar. Mean of 100 simulations, error bars are not shown for the sake of clarity. (MU, motor unit).
Figure 4
Figure 4. An Illustration of a Hypothetical Gradual Transition of Myofascial Pain to Chronicity Over Time
Total muscle strength (green); threshold muscle load beyond which motor unit relaxation time falls below a critical value and an energy crisis occurs (red); actual load on the muscle (blue). Myofascial pain episodes occur when the muscle load exceeds the threshold load (arrows). These episodes increase in frequency as a muscle weakens, and eventually even low, everyday loads exceed the declining threshold, and chronicity ensues.

References

    1. Bennett R. Myofascial pain syndromes and their evaluation. Best Pract Res Clin Rheumatol. 2007;21:427–45. doi: 10.1016/j.berh.2007.02.014. - DOI - PubMed
    1. Fishbain DA, Goldberg M, Meagher BR, Steele R, Rosomoff H. Male and female chronic pain patients categorized by DSM-III psychiatric diagnostic criteria. Pain. 1986;26:181–97. doi: 10.1016/0304-3959(86)90074-6. - DOI - PubMed
    1. Gerwin RD. Classification, epidemiology, and natural history of myofascial pain syndrome. Curr Pain Headache Rep. 2001;5:412–20. doi: 10.1007/s11916-001-0052-8. - DOI - PubMed
    1. Skootsky SA, Jaeger B, Oye RK. Prevalence of myofascial pain in general internal medicine practice. West J Med. 1989;151:157–60. - PMC - PubMed
    1. Sola AE, Rodenberger ML, Gettys BB. Incidence of hypersensitive areas in posterior shoulder muscles; a survey of two hundred young adults. Am J Phys Med. 1955;34:585–90. - PubMed

LinkOut - more resources