

ErbB4 deletion predisposes to development of metabolic syndrome in mice
- PMID: 29944391
- PMCID: PMC6230712
- DOI: 10.1152/ajpendo.00166.2018
ErbB4 deletion predisposes to development of metabolic syndrome in mice
Abstract
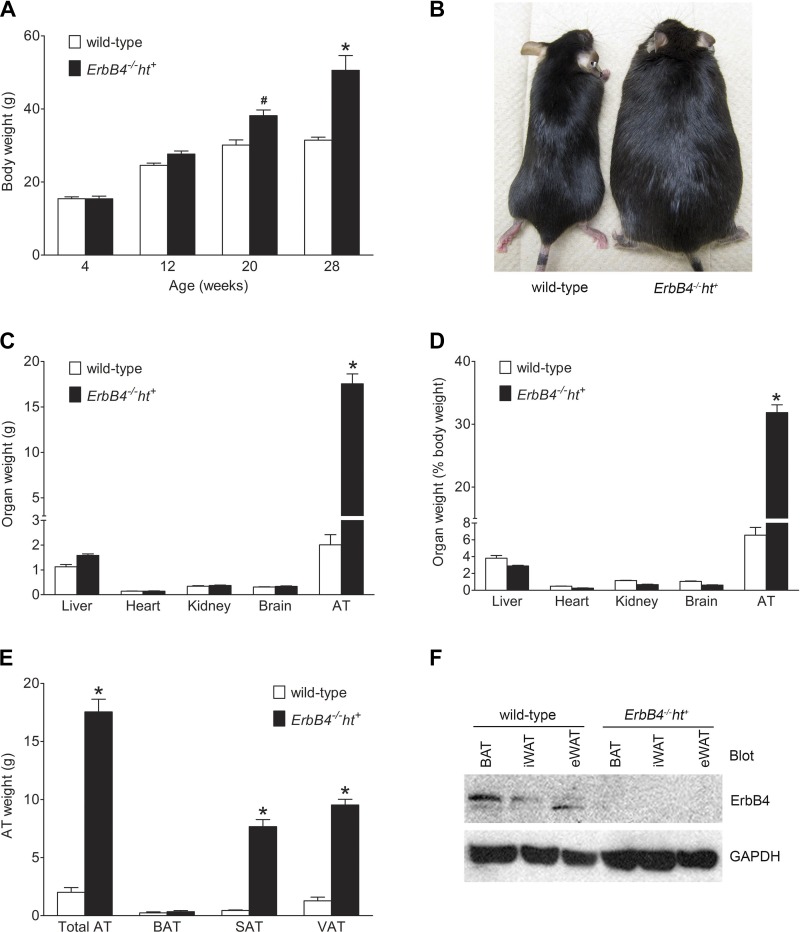
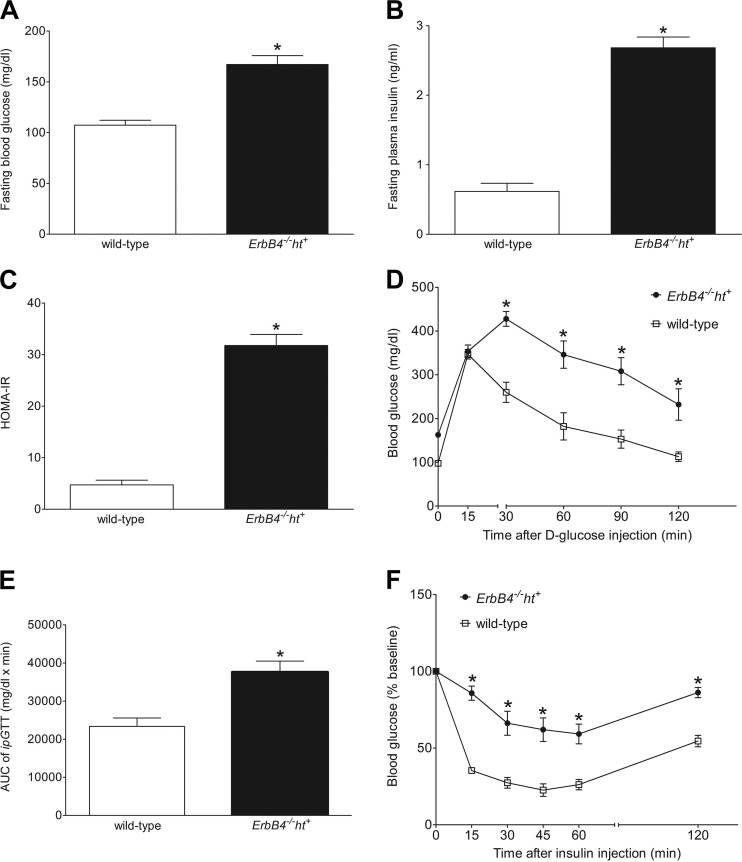
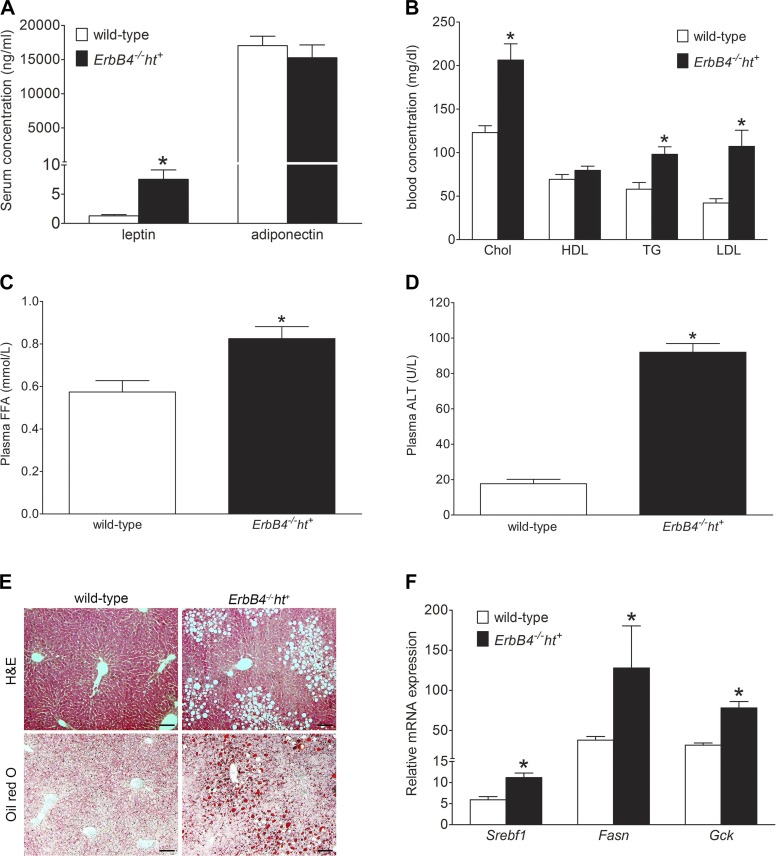
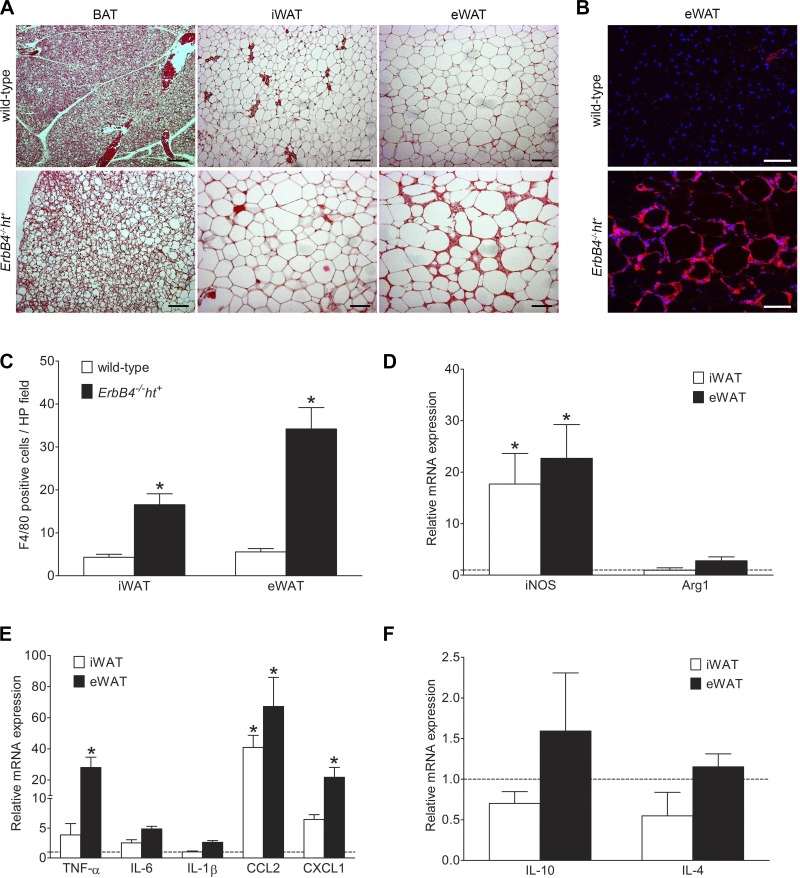
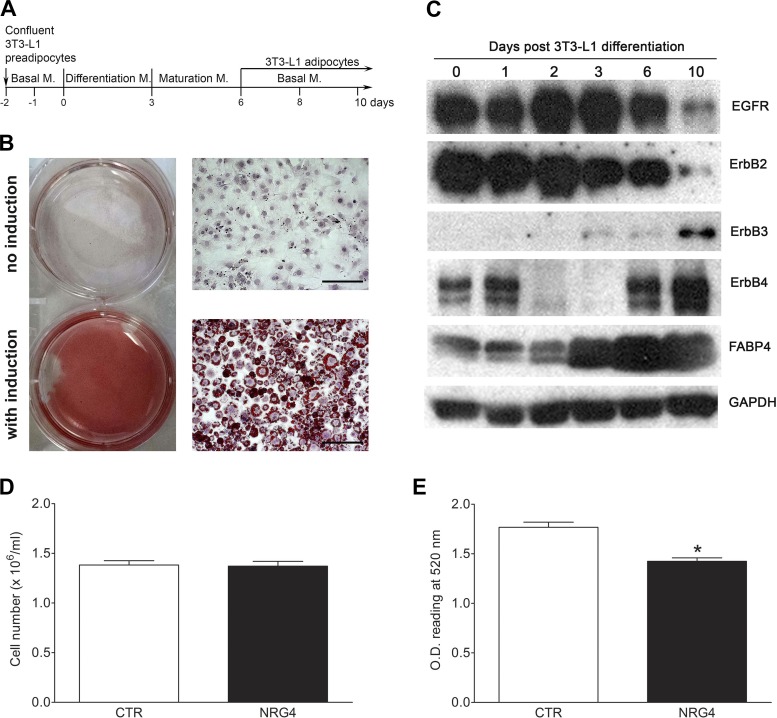
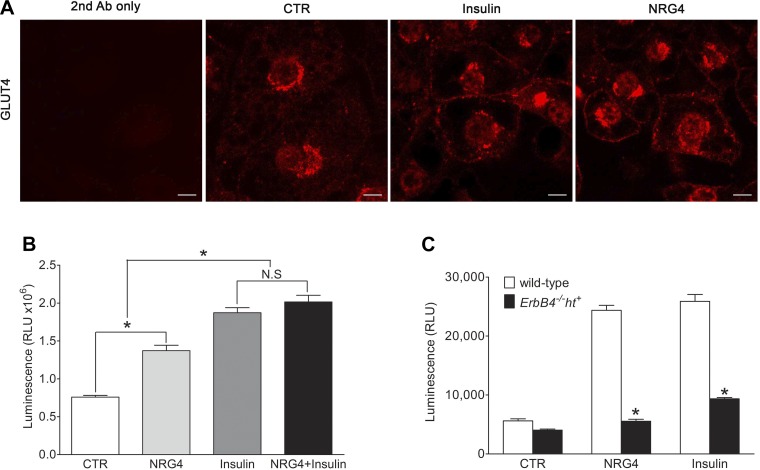
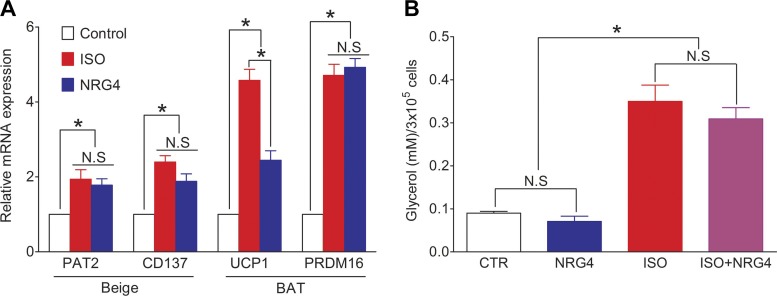
ErbB4, a member of the EGF receptor family, plays a variety of roles in physiological and pathological states. Genetic studies have indicated a link between ErbB4 and type 2 diabetes and obesity, but its role in metabolic syndrome (MetS) has not been reported. In the current study we found that mice with ErbB4 deletion developed MetS after 24 wk on a medium-fat diet (MFD), as indicated by development of obesity, dyslipidemia, hepatic steatosis, hyperglycemia, hyperinsulinemia, and insulin resistance, compared with wild-type mice. ErbB4 deletion mice also exhibited increased amounts of subcutaneous and visceral fat, with increased serum leptin levels, compared with wild-type mice, whereas levels of adiponectin were not significantly different. Histologically, severe inflammation, indicated by F4/80 immunostaining and M1 macrophage polarization, was detected in inguinal and epididymal white adipose tissue in ErbB4 deletion mice. ErbB4 expression decreased during 3T3-L1 preadipocyte differentiation. Administration of neuroregulin 4, a specific ligand for ErbB4, to 3T3-L1 adipocytes had no effect on adipogenesis and lipolysis but significantly inhibited lipogenesis, promoted browning, induced GLUT4 redistribution to the cell membrane, and increased glucose uptake. Neuroregulin 4 also significantly increased glucose uptake in adipocytes isolated from wild-type mice, while these effects were significantly decreased in adipocytes isolated from ErbB4 deletion mice. In conclusion, our results indicate that ErbB4 may play an important role in glucose homeostasis and lipogenesis. ErbB4 deficiency-related obesity and adipose tissue inflammation may contribute to the development of MetS.
Keywords: ErbB4; inflammation; insulin resistance; lipogenesis; neuregulin 4.
Figures
Similar articles
-
The brown fat-enriched secreted factor Nrg4 preserves metabolic homeostasis through attenuation of hepatic lipogenesis.Nat Med. 2014 Dec;20(12):1436-1443. doi: 10.1038/nm.3713. Epub 2014 Nov 17. Nat Med. 2014. PMID: 25401691 Free PMC article.
-
Porcine adiponectin receptor 1 transgene resists high-fat/sucrose diet-induced weight gain, hepatosteatosis and insulin resistance in mice.Exp Anim. 2013;62(4):347-60. doi: 10.1538/expanim.62.347. Exp Anim. 2013. PMID: 24172199 Free PMC article.
-
Pigment epithelium-derived factor inhibits adipogenesis in 3T3-L1 adipocytes and protects against high-fat diet-induced obesity and metabolic disorders in mice.Transl Res. 2019 Aug;210:26-42. doi: 10.1016/j.trsl.2019.04.006. Epub 2019 May 3. Transl Res. 2019. PMID: 31121128
-
Adipose tissue regulates insulin sensitivity: role of adipogenesis, de novo lipogenesis and novel lipids.J Intern Med. 2016 Nov;280(5):465-475. doi: 10.1111/joim.12540. Epub 2016 Oct 3. J Intern Med. 2016. PMID: 27699898 Free PMC article. Review.
-
Lipodystrophy: metabolic insights from a rare disorder.J Endocrinol. 2010 Dec;207(3):245-55. doi: 10.1677/JOE-10-0272. Epub 2010 Sep 24. J Endocrinol. 2010. PMID: 20870709 Review.
Cited by
-
Human pangenome analysis of sequences missing from the reference genome reveals their widespread evolutionary, phenotypic, and functional roles.Nucleic Acids Res. 2024 Mar 21;52(5):2212-2230. doi: 10.1093/nar/gkae086. Nucleic Acids Res. 2024. PMID: 38364871 Free PMC article.
-
MiR-146a-5p, targeting ErbB4, promotes 3T3-L1 preadipocyte differentiation through the ERK1/2/PPAR-γ signaling pathway.Lipids Health Dis. 2022 Jun 15;21(1):54. doi: 10.1186/s12944-022-01662-6. Lipids Health Dis. 2022. PMID: 35705996 Free PMC article.
-
Energy Expenditure Homeostasis Requires ErbB4, an Obesity Risk Gene, in the Paraventricular Nucleus.eNeuro. 2023 Sep 25;10(9):ENEURO.0139-23.2023. doi: 10.1523/ENEURO.0139-23.2023. Print 2023 Sep. eNeuro. 2023. PMID: 37669858 Free PMC article.
-
Alteration of serum neuregulin 4 and neuregulin 1 in gestational diabetes mellitus.Ther Adv Endocrinol Metab. 2021 Oct 8;12:20420188211049614. doi: 10.1177/20420188211049614. eCollection 2021. Ther Adv Endocrinol Metab. 2021. PMID: 34646438 Free PMC article.
-
Genome-wide association study of morbid obesity in Han Chinese.BMC Genet. 2019 Dec 18;20(1):97. doi: 10.1186/s12863-019-0797-x. BMC Genet. 2019. PMID: 31852448 Free PMC article.
References
Publication types
MeSH terms
Substances
Grants and funding
LinkOut - more resources
Full Text Sources
Other Literature Sources
Medical
Molecular Biology Databases