. 2018 Jun 26;14(6):e1006115.
doi: 10.1371/journal.pcbi.1006115. eCollection 2018 Jun.

Age density patterns in patients medical conditions: A clustering approach

Affiliations

Age density patterns in patients medical conditions: A clustering approach

Fahad Alhasoun et al. PLoS Comput Biol. .

Abstract

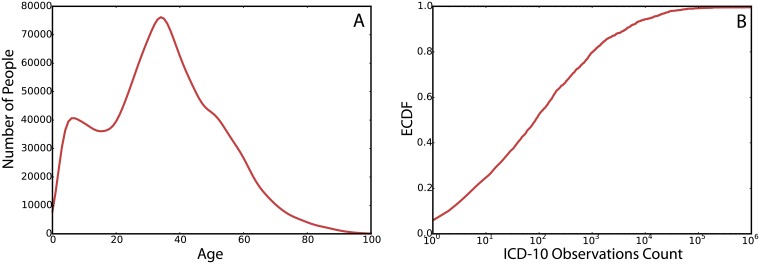
This paper presents a data analysis framework to uncover relationships between health conditions, age and sex for a large population of patients. We study a massive heterogeneous sample of 1.7 million patients in Brazil, containing 47 million of health records with detailed medical conditions for visits to medical facilities for a period of 17 months. The findings suggest that medical conditions can be grouped into clusters that share very distinctive densities in the ages of the patients. For each cluster, we further present the ICD-10 chapters within it. Finally, we relate the findings to comorbidity networks, uncovering the relation of the discovered clusters of age densities to comorbidity networks literature.


Conflict of interest statement

The authors have declared that no competing interests exist.

Figures

Fig 1
Fig 1
(A) The distribution of age in patients. (B) The cumulative density function of the ICD-10 codes by the number of observations in the data.
Fig 2
Fig 2. Network representation of the ICD-10 grouped in their 22 category chapters.
The weight of the links represent the number of co-occurrences in the patients records and the size of the nodes represent the frequency of each chapter.
Fig 3
Fig 3. Age distribution for patients with Chickenpox (A) and Glaucoma (B).
Fig 4
Fig 4. Lines in gray represent cumulative distribution of P(age|patientsc) and lines in red are the cluster averages for illustration.
The clusters of ICD-10 codes given by the HAC are labeled from A to F. Cluster A of ICD-10 codes have more concentration towards infants and children. Cluster B of diseases having a density closer to a uniform but with a tendency to have relatively more concentration in teenage years and early adulthood. Cluster C has the narrowest concentration of age in the thirties. Cluster D groups codes that distribute uniformly in all ages. Cluster E groups codes for ages over 60. Cluster F groups ICD-10 codes in patients over 70.
Fig 5
Fig 5. Hierarchical clustering with a depth of six in the dendrogram tree, branches of depth higher than six are represented by the ICD-10 code that is most common in that branch.
The frequency of each ICD-10 code is in parenthesis in percentage of the total population of patients. The alphabet letters assignments correspond to the clusters discussed in Fig 4.
Fig 6
Fig 6. Patient characteristics per cluster.
(A) Sex distribution. (B) Age distribution. (C) Probability of associations between our identified clusters and the category chapters of ICD10 codes (1 − (p- value)). The alphabet letters correspond to the clusters discussed in Fig 4.
Fig 7
Fig 7. The comorbidity network of highest two thousand values of relative risk (i.e. comorbidity).
Nodes in the network are ICD-10 codes and edges represent the relative risk between the disease codes, the edges displayed in the figure belong to the highest two thousand relative risk values for purposes of visualization. Edges in the network (A) show intra-cluster comorbidities and edges in network (B) shows the inter-cluster comorbidities.
Fig 8
Fig 8. The distribution of relative risk for inter versus intra cluster edges.
In gray is the distribution of relative risk of inter-cluster edges. In red are the distributions of relative risk for intra-cluster edges for the respective cluster.

Similar articles

Cited by

References

    1. Murray SA, Kendall M, Boyd K, Sheikh A. Illness trajectories and palliative care. Int Perspect Public Health Palliat Care. 2012;30:2017–19.
    1. Camilo O, Goldstein LB. Seizures and epilepsy after ischemic stroke. Stroke. 2004;35(7):1769–1775. doi: 10.1161/01.STR.0000130989.17100.96 - DOI - PubMed
    1. Murtagh FE, Murphy E, Sheerin NS. Illness trajectories: an important concept in the management of kidney failure. Nephrology Dialysis Transplantation. 2008;23(12):3746–3748. doi: 10.1093/ndt/gfn532 - DOI - PubMed
    1. Teno JM, Weitzen S, Fennell ML, Mor V. Dying trajectory in the last year of life: does cancer trajectory fit other diseases? Journal of palliative medicine. 2001;4(4):457–464. doi: 10.1089/109662101753381593 - DOI - PubMed
    1. Finkelstein J, Cha E, Scharf SM. Chronic obstructive pulmonary disease as an independent risk factor for cardiovascular morbidity. International journal of chronic obstructive pulmonary disease. 2009;4:337 doi: 10.2147/COPD.S6400 - DOI - PMC - PubMed

Publication types