

Predicting the spectrum of TCR repertoire sharing with a data-driven model of recombination
- PMID: 29944757
- PMCID: PMC6033145
- DOI: 10.1111/imr.12665
Predicting the spectrum of TCR repertoire sharing with a data-driven model of recombination
Abstract
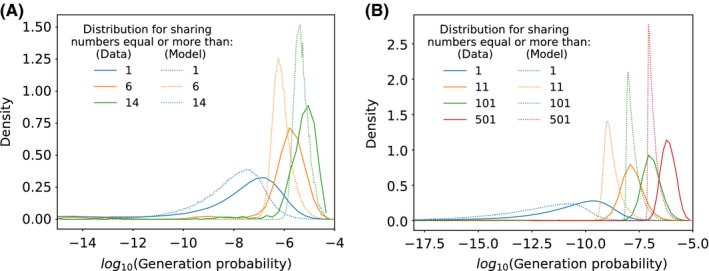
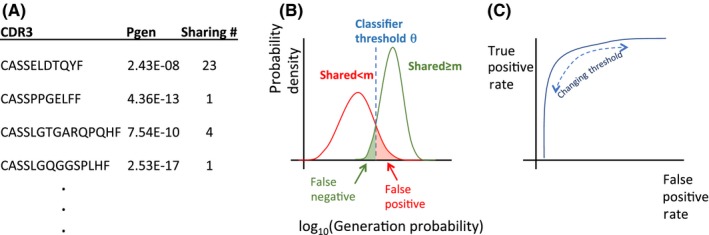
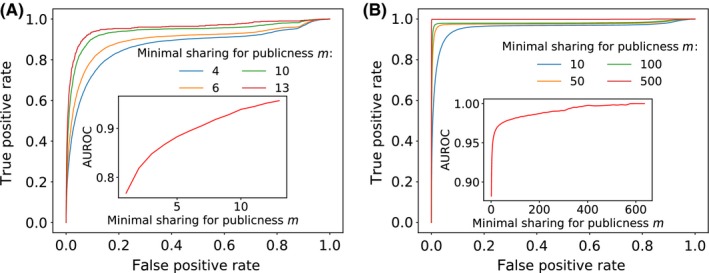
Despite the extreme diversity of T-cell repertoires, many identical T-cell receptor (TCR) sequences are found in a large number of individual mice and humans. These widely shared sequences, often referred to as "public," have been suggested to be over-represented due to their potential immune functionality or their ease of generation by V(D)J recombination. Here, we show that even for large cohorts, the observed degree of sharing of TCR sequences between individuals is well predicted by a model accounting for the known quantitative statistical biases in the generation process, together with a simple model of thymic selection. Whether a sequence is shared by many individuals is predicted to depend on the number of queried individuals and the sampling depth, as well as on the sequence itself, in agreement with the data. We introduce the degree of publicness conditional on the queried cohort size and the size of the sampled repertoires. Based on these observations, we propose a public/private sequence classifier, "PUBLIC" (Public Universal Binary Likelihood Inference Classifier), based on the generation probability, which performs very well even for small cohort sizes.
Keywords: TCR repertoires; TCR sharing; inference; probability of generation; public sequences.
© 2018 The Authors. Immunological Reviews Published by John Wiley & Sons Ltd.
Figures
Similar articles
-
A Framework for Annotation of Antigen Specificities in High-Throughput T-Cell Repertoire Sequencing Studies.Front Immunol. 2019 Sep 26;10:2159. doi: 10.3389/fimmu.2019.02159. eCollection 2019. Front Immunol. 2019. PMID: 31616409 Free PMC article.
-
Sharing of T cell receptors in antigen-specific responses is driven by convergent recombination.Proc Natl Acad Sci U S A. 2006 Dec 5;103(49):18691-6. doi: 10.1073/pnas.0608907103. Epub 2006 Nov 27. Proc Natl Acad Sci U S A. 2006. PMID: 17130450 Free PMC article.
-
Insights into immune system development and function from mouse T-cell repertoires.Proc Natl Acad Sci U S A. 2017 Feb 28;114(9):2253-2258. doi: 10.1073/pnas.1700241114. Epub 2017 Feb 14. Proc Natl Acad Sci U S A. 2017. PMID: 28196891 Free PMC article.
-
Determinants of public T cell responses.Cell Res. 2012 Jan;22(1):33-42. doi: 10.1038/cr.2012.1. Epub 2012 Jan 3. Cell Res. 2012. PMID: 22212481 Free PMC article. Review.
-
Epigenetic aspects of lymphocyte antigen receptor gene rearrangement or 'when stochasticity completes randomness'.Immunology. 2013 Jun;139(2):141-50. doi: 10.1111/imm.12057. Immunology. 2013. PMID: 23278765 Free PMC article. Review.
Cited by
-
Treg Enhancing Therapies to Treat Autoimmune Diseases.Int J Mol Sci. 2020 Sep 23;21(19):7015. doi: 10.3390/ijms21197015. Int J Mol Sci. 2020. PMID: 32977677 Free PMC article. Review.
-
Dynamics of B cell repertoires and emergence of cross-reactive responses in patients with different severities of COVID-19.Cell Rep. 2021 May 25;35(8):109173. doi: 10.1016/j.celrep.2021.109173. Epub 2021 May 9. Cell Rep. 2021. PMID: 33991510 Free PMC article.
-
Human T cell receptor occurrence patterns encode immune history, genetic background, and receptor specificity.Elife. 2018 Aug 28;7:e38358. doi: 10.7554/eLife.38358. Elife. 2018. PMID: 30152754 Free PMC article.
-
Autoencoder based local T cell repertoire density can be used to classify samples and T cell receptors.PLoS Comput Biol. 2021 Jul 26;17(7):e1009225. doi: 10.1371/journal.pcbi.1009225. eCollection 2021 Jul. PLoS Comput Biol. 2021. PMID: 34310600 Free PMC article.
-
CDR3 and V genes show distinct reconstitution patterns in T cell repertoire post-allogeneic bone marrow transplantation.Immunogenetics. 2021 Apr;73(2):163-173. doi: 10.1007/s00251-020-01200-7. Epub 2021 Jan 21. Immunogenetics. 2021. PMID: 33475766
References
-
- Mora T, Walczak A. Quantifying lymphocyte receptor diversity. In: Das J, Jayaprakash C, eds. Systems Immunology: An Introduction to Modeling Methods for Scientists. Boca Raton, FL: CRC Press, Taylor and Francis; 2018;1–10.
Publication types
MeSH terms
Substances
LinkOut - more resources
Full Text Sources
Other Literature Sources
