. 2019 Jan 15;35(2):189-199.
doi: 10.1093/bioinformatics/bty511.

ncdDetect2: improved models of the site-specific mutation rate in cancer and driver detection with robust significance evaluation

Affiliations

ncdDetect2: improved models of the site-specific mutation rate in cancer and driver detection with robust significance evaluation

Malene Juul et al. Bioinformatics. .

Abstract

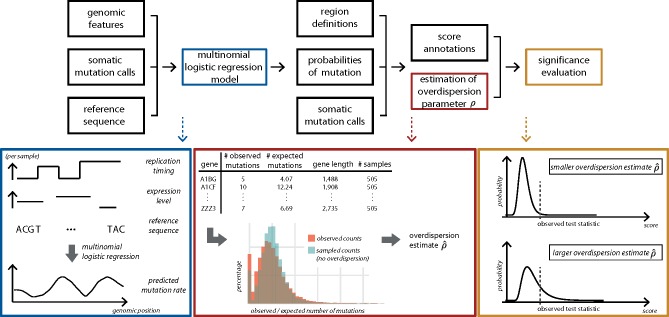
Motivation: Understanding the mutational processes that act during cancer development is a key topic of cancer biology. Nevertheless, much remains to be learned, as a complex interplay of processes with dependencies on a range of genomic features creates highly heterogeneous cancer genomes. Accurate driver detection relies on unbiased models of the mutation rate that also capture rate variation from uncharacterized sources.

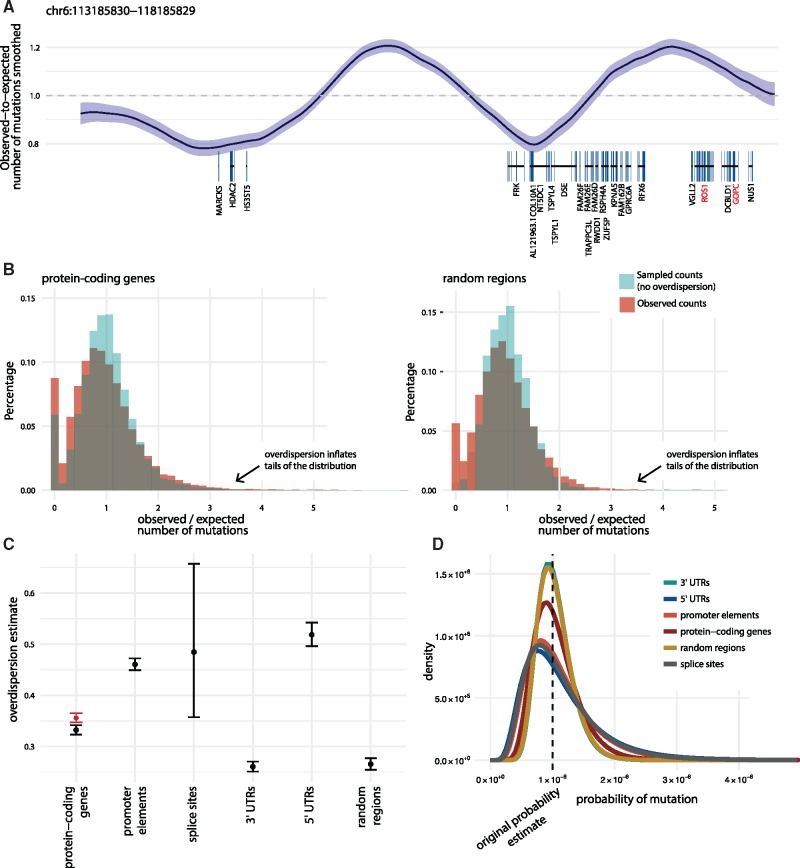
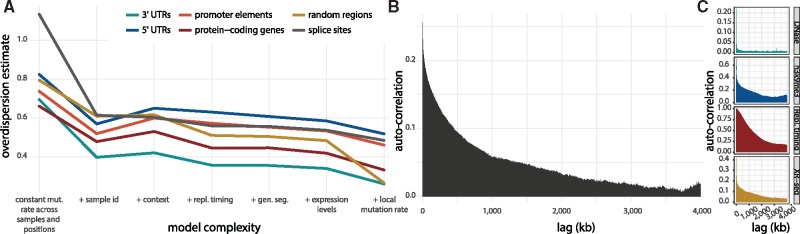
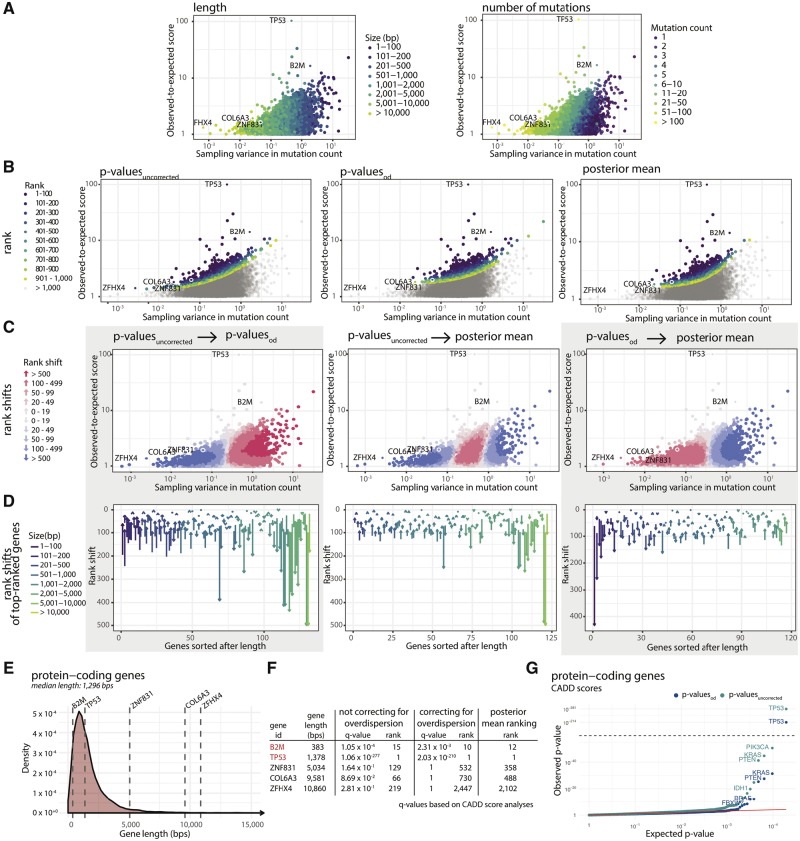
Results: Here, we analyse patterns of observed-to-expected mutation counts across 505 whole cancer genomes, and find that genomic features missing from our mutation-rate model likely operate on a megabase length scale. We extend our site-specific model of the mutation rate to include the additional variance from these sources, which leads to robust significance evaluation of candidate cancer drivers. We thus present ncdDetect v.2, with greatly improved cancer driver detection specificity. Finally, we show that ranking candidates by their posterior mean value of their effect sizes offers an equivalent and more computationally efficient alternative to ranking by their P-values.

Availability and implementation: ncdDetect v.2 is implemented as an R-package and is freely available at http://github.com/TobiasMadsen/ncdDetect2.

Supplementary information: Supplementary data are available at Bioinformatics online.


Figures

Fig. 1.
Fig. 1.
Overview of ncdDetect v.2. For each sample, the genomic features replication timing, expression level and reference sequence are used as explanatory variables to predict the sample- and position specific probabilities of mutation in a multinomial logistic regression model (blue box). For a specific genomic region type, the observed and expected number of mutations are collected for each specific candidate element (red box; illustrated for protein-coding genes). This information is applied to estimate the overdispersion parameter ρ as explained in Section 2.4. The estimated amount of overdispersion is accounted for in the significance evaluation of each candidate element, as explained in Section 2.2. The larger the overdispersion estimate, the harder it will be for a genomic candidate element to reach significance (yellow box)
Fig. 2.
Fig. 2.
Illustration and estimation of overdispersion. (A) The smoothed ratio between the observed and expected number of mutations on representative 5 Mb genomic section (chr6: 113 185 830–118 185 829). Mutation counts are considered in bins of size 1 kb. Bottom: Protein-coding genes with COSMIC CGC genes highlighted (red). In regions where the mutation rate is underestimated (observed-to-expected ratio > 1), ncdDetect v.1 is likely to call false positive cancer drivers. (B) Observed-to-expected number of mutations shown for protein-coding genes as well as 10 000 randomly sampled regions, all of length equal to the median length of protein-coding genes (1300 bps). The ratio between observed and expected mutation counts are shown (red histograms). For each region of a given region type, a set of mutations were sampled directly from the background model. The ratio between the sampled and expected counts are similarly depicted (blue histograms). The overlaid histograms illustrate the two main sources of variation in the observed-to-expected ratio; namely sampling variance and overdispersion. Similar plots for the remaining region types are shown in Supplementary Figure S1. The observed and expected number of mutations for a given region type are used for overdispersion estimation. (C) The estimated overdispersion parameters, including 95% confidence limits, calculated for each considered region type. For protein-coding genes, results are shown both including (red) and excluding (black) known drivers. (D) A typical position with a predicted mutation probability of 10−6 is considered. The densities show the variation around this point estimate given by the overdispersion estimate for the different region types. The densities are obtained as logit transforms of normal variables, whose variances are determined by the amount of overdispersion. The resulting distribution is known as a logit-normal (Supplementary Section S5)
Fig. 3.
Fig. 3.
Overdispersion as an effect of missing genomic features in the background mutation model. (A) Overdispersion estimates on the basis of background models of increasing complexity. The simplest model with a constant mutation rate across all samples and positions results in the highest overdispersion estimate across all region types. For increasingly complex models, the overdispersion estimate has a decreasing trend. In the model furthest to the right, a correction for local mutation rate is performed, as described in Section 2.7. (B) The autocorrelation between observed-to-expected mutation rate in 1 kb windows, based on approximately 1 Gb scattered across the genome. The autocorrelation decreases slowly over approximately a few megabases, suggesting that genomic features that vary slowly across the genome are missing. (C) Auto-correlation functions for DNase hypersensitivity, h3k9me3 histone modification, replication timing and nucleotide excision repair (XR-seq) for comparison
Fig. 4.
Fig. 4.
Comparison of ranking methods. (A) We define the effect size as the ratio between the observed and expected score of functional impact, here CADD score. The effect size is plotted against the sampling variance of the effect size under the null-model. A high sampling variance means the outcome is uncertain and an extreme effect size is needed to achieve significance. The sampling variance decreases with region length and effect size increases with the number of mutations. (B) Points colored according to their rank under each of the three different ranking methods. Compared to P-valuesuncorrected,P-valuesod and posterior mean (PM) both put more emphasis on effect size compared to sampling variance. (C) Pairwise comparison of ranking methods. The shift in rank for all elements having a positive effect size. P-valuesod generally give higher ranks to short genes with moderate to large effect size. PM has a similar effect, but it does not give higher ranks to the shortest of genes. (D) Pairwise comparison of ranking methods for top-ranked genes. The shift in rank for all elements ranked in top-100 for either of two methods. Long genes are generally ranked much lower using P-valuesod and PM compared to P-valuesuncorrected. (E) The lengths of five selected genes are highlighted in a density plot showing the length distribution of all protein-coding genes. (F) Re-ranking of individual elements of representative lengths when ranking according to P-valuesod and PM. The three long protein-coding genes ZFHX4, ZNF831 and COL6A3 all become less significant when taking overdispersion into account and are down-ranked by PM. The known short COSMIC CGC gene B2M is up-ranked with both overdispersion and posterior mean. G: CADD score-based QQplots of P-values for protein-coding genes obtained with and without overdispersion. QQplots for the remaining region types are shown in Supplementary Figure S2
Fig. 5.
Fig. 5.
Performance of ncdDetect v.2 after correcting for overdispersion. (A) A comparison of the fraction of COSMIC CGC genes among top-ranked candidates. Results shown are obtained by ranking elements according to P-valuesod as well as PM, using both CADD and phyloP scores. For P-value based results, filled points denote significant elements (q < 0.10), while crosses denote insignificant elements (q 0.10). For PM-based results, there are no filled points due to the inability to determine significance in this setting. (B) QQplots of P-valuesod for each considered region type obtained with phyloP, CADD or LINSIGHT scores. Note that LINSIGHT scores are not available for protein-coding genes. (C) Cancer driver candidates identified with ncdDetect v.2 using CADD scores, after accounting for overdispersion. All elements with a colored tile have a q-value less than 0.10. Melanoma-specific results are shown in Supplementary Figure S3

Similar articles

Cited by

References

    1. Benjamini Y., Hochberg Y. (1995) Controlling the false discovery rate: a practical and powerful approach to multiple testing. J. R. Stat. Soc. Ser. B (Methodological), 57, 289–300.
    1. Bertl J. et al. (2018) A site specific model and analysis of the neutral somatic mutation rate in whole-genome cancer data. BMC Bioinformatics, 19, 147. - PMC - PubMed
    1. Box G.E. et al. (2015) Time Series Analysis: Forecasting and Control. John Wiley & Sons Inc., Hoboken, New Jersey, USA.
    1. Chen C.-L. et al. (2010) Impact of replication timing on non-CpG and CpG substitution rates in mammalian genomes. Genome Res., 20, 447–457. - PMC - PubMed
    1. ENCODE Project Consortium and others. (2012) An integrated encyclopedia of DNA elements in the human genome. Nature, 489, 57–74. - PMC - PubMed

Publication types