. 2018 Sep 6;46(15):7566-7585.
doi: 10.1093/nar/gky554.

Toward predictive R-loop computational biology: genome-scale prediction of R-loops reveals their association with complex promoter structures, G-quadruplexes and transcriptionally active enhancers

Affiliations

Toward predictive R-loop computational biology: genome-scale prediction of R-loops reveals their association with complex promoter structures, G-quadruplexes and transcriptionally active enhancers

Vladimir A Kuznetsov et al. Nucleic Acids Res. .

Erratum in

Abstract

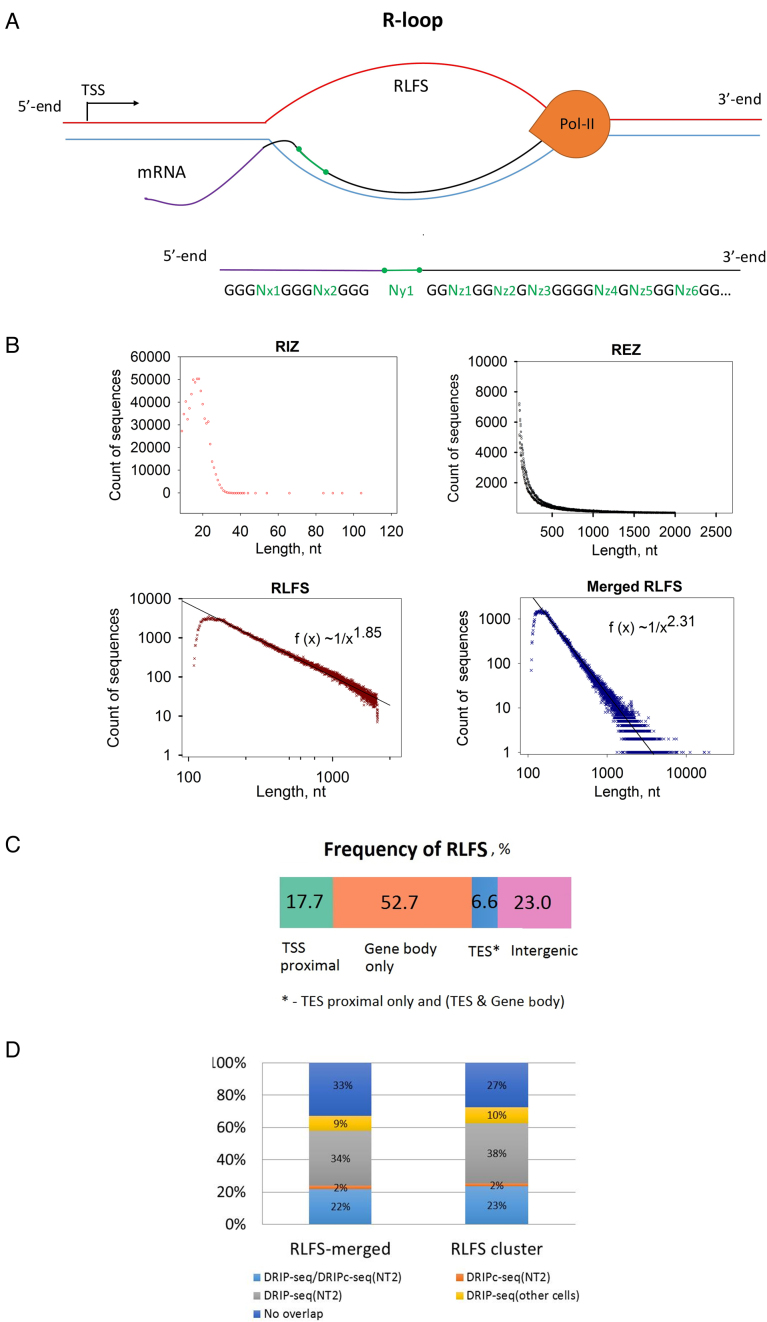
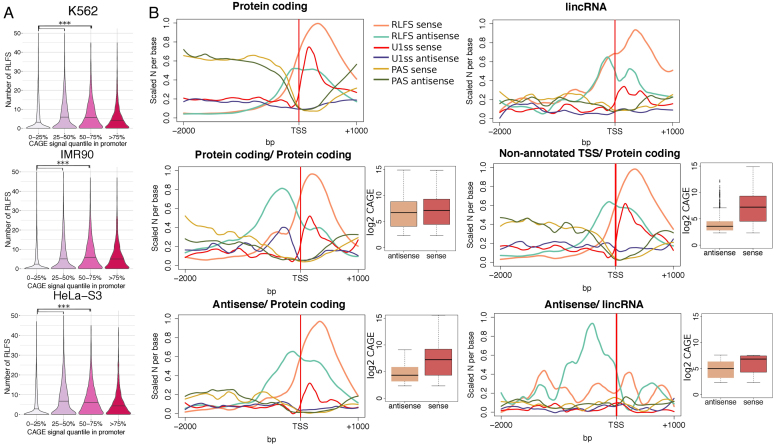
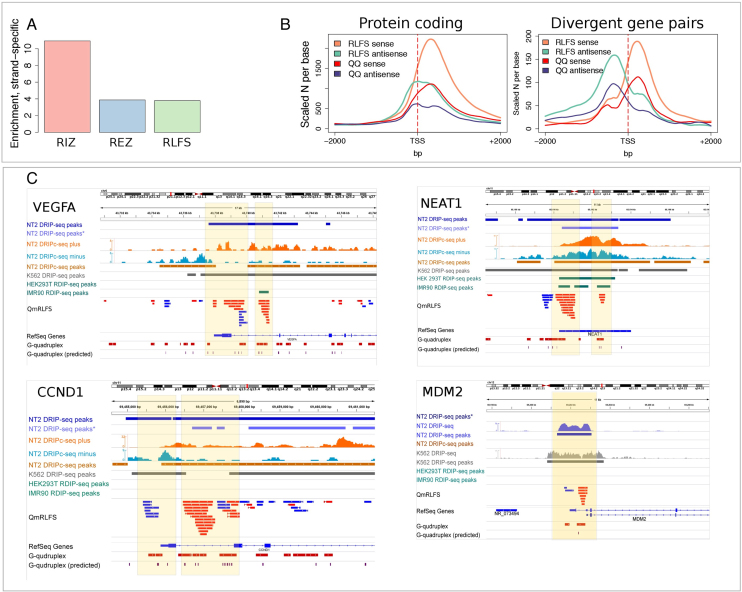
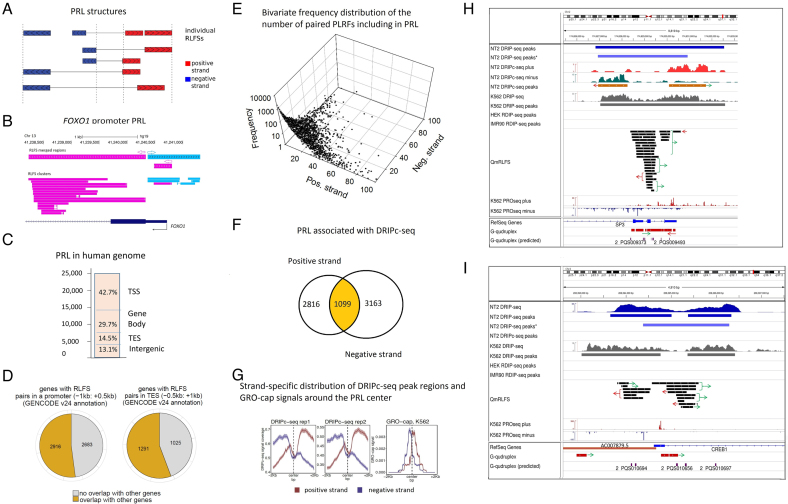
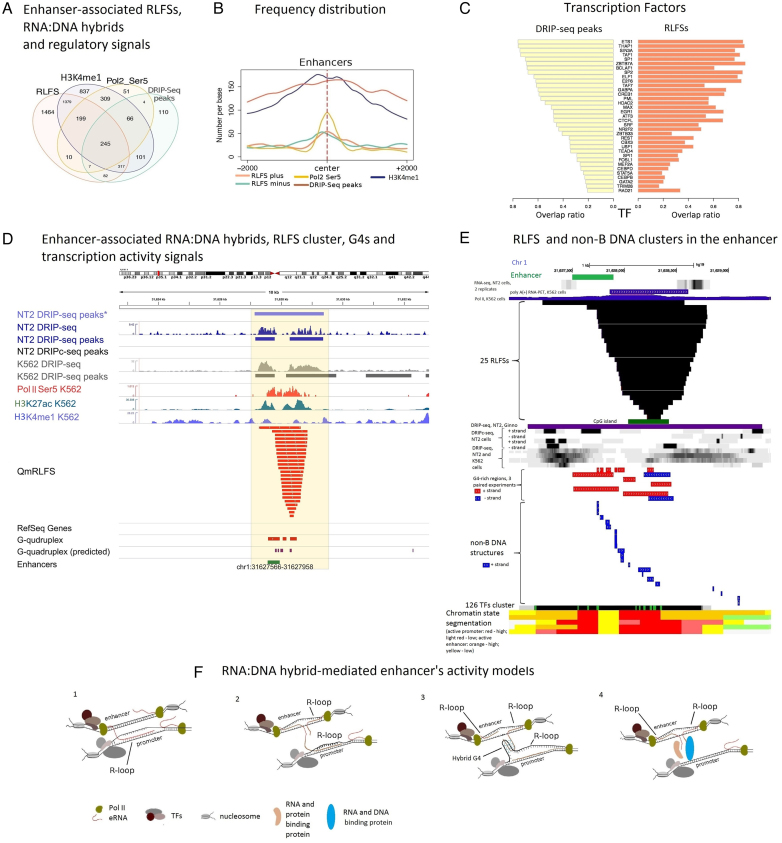
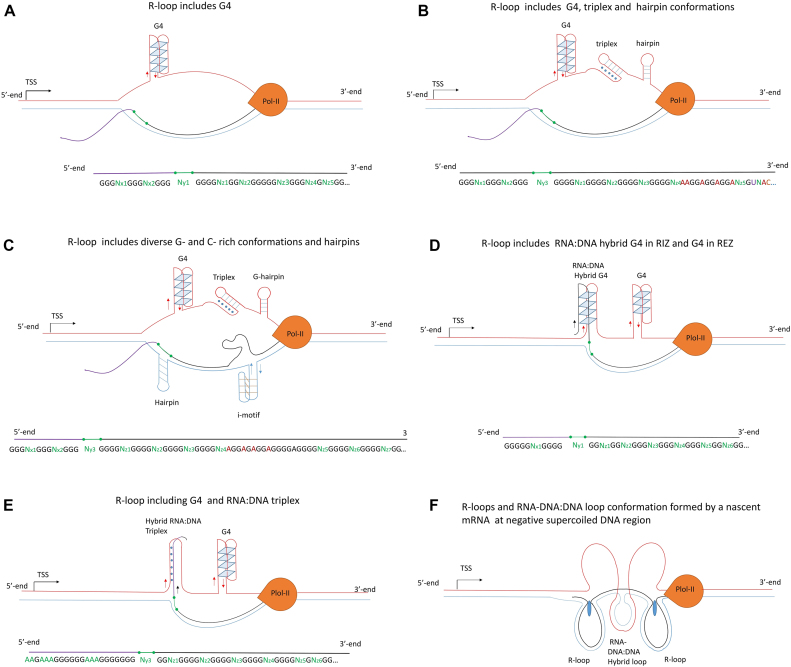
R-loops are three-stranded RNA:DNA hybrid structures essential for many normal and pathobiological processes. Previously, we generated a quantitative R-loop forming sequence (RLFS) model, quantitative model of R-loop-forming sequences (QmRLFS) and predicted ∼660 000 RLFSs; most of them located in genes and gene-flanking regions, G-rich regions and disease-associated genomic loci in the human genome. Here, we conducted a comprehensive comparative analysis of these RLFSs using experimental data and demonstrated the high performance of QmRLFS predictions on the nucleotide and genome scales. The preferential co-localization of RLFS with promoters, U1 splice sites, gene ends, enhancers and non-B DNA structures, such as G-quadruplexes, provides evidence for the mechanical linkage between DNA tertiary structures, transcription initiation and R-loops in critical regulatory genome regions. We introduced and characterized an abundant class of reverse-forward RLFS clusters highly enriched in non-B DNA structures, which localized to promoters, gene ends and enhancers. The RLFS co-localization with promoters and transcriptionally active enhancers suggested new models for in cis and in trans regulation by RNA:DNA hybrids of transcription initiation and formation of 3D-chromatin loops. Overall, this study provides a rationale for the discovery and characterization of the non-B DNA regulatory structures involved in the formation of the RNA:DNA interactome as the basis for an emerging quantitative R-loop biology and pathobiology.


Figures

Figure 1.
Figure 1.
Statistical distributions and characteristics of the RLFS and RLFS's structures. (A) Structural model of RLFS: short G-cluster-rich region thought to be responsible for the initiation of R-loop formation (RIZ), structurally non-specified short linker (linker) and linker downstream of long high-/moderate-G-density region (called R-loop elongation zone or REZ). REZ could provide for RNA:DNA hybrid/R-loop stabilization. For detailed quantitative characteristics of the QmRLFS model, see (33,50). (B) The length frequency distribution of the RIZ, REZ, RLFS and merged RLFSs. Power law-like function tails on the right of the RLFS and merged RLFS length distributions fit data well (goodness of fit linear regression; P < 0.001). (C) The distribution (%) of RLFSs in ‘gene body’, ‘TSS-proximal’, ‘TES-proximal’ and ‘intergenic’ genome regions (Supplementary Materials: Identification of the genes, TSS-proximal and TES-proximal regions). (D) Merged RLFS and clustered RLFS regions overlapped with DRIP-Seq and RDIP-Seq peak regions defined in (45–48) in promoters (−1 kb; +2 kb from the TSS), TES (+2 kb; −1 kb from the annotated TES), gene bodies (excluding 2 kb from 5′ and 3′ gene ends) and outside of annotated genes (with 2 kb added to 5′ and 3′ gene ends). All genes longer than 4.5 kb were considered (N = 17 889 genes).
Figure 2.
Figure 2.
RLFS boundaries correlate with TSSs and transcription directionality. (A) Distributions of the numbers of RLFSs at the proximity of promoter regions. To define unidirectional promoters, −500, +1 kb regions of annotated gene TSSs without intersecting TSSs on the opposite strand were considered (N = 52 900), CAGE clusters were defined as described in the ‘Materials and Methods’ section (CAGE-Seq data analysis); promoters were divided into four classes by the CAGE clusters signal intensity (0–25, 25–50, 50–75, 75–100 percentiles). For each cell line, the promoters with a single CAGE cluster were selected, and the numbers of overlapping RLFSs per promoter region were calculated. The black line on violin plot denotes median of the distribution; RLFSs were significantly enriched in promoters of moderately expressed genes (50–75% of CAGE signal intensity) compared to low (0–25%) and low-moderately expressed (25–50%) (P-value < 2.2e-16 by one-sided Wilcoxon rank sum test). (B) RLFS, U1 and PAS motif distributions on the sense and antisense DNA strands in promoters of stand-alone protein-coding genes (N = 4793), lincRNAs (N = 194) and divergent gene pairs: protein-coding/protein-coding (N = 522), protein-coding/antisense transcripts (N = 204), protein-coding/non-annotated transcripts (overlapping with a CAGE cluster on the antisense strand, N = 954) and lincRNA/antisense transcripts (N = 36). Promoters were classified as described in the ‘Materials and Methods’ section (defining unidirectional and divergent gene promoters). The sequence/signal count densities were scaled per maximum number considering sequences/signals from both sense and antisense strands. Red and brown box plots illustrate sequence/signal distributions of the total number of CAGE clusters on the sense and antisense strands downstream (1 kb) and upstream (2 kb) of the annotated TSS, respectively.
Figure 3.
Figure 3.
RLFSs are co-enriched with experimental G4 sequences genome-wide. (A) Enrichment of experimental G4 structures on the sense RLFS strand. Enrichment was calculated as a ratio of number of the G4-positive merged RLFS sequences (RIZ, REZ or entire RLFS with at least one G4 on the sense strand) to the number of the G4-positive merged RLFS sequences (RIZ, REZ or entire RLFS with at least one G4, respectively) found on the same genome double strand position on the antisense strand. The strand orientation was defined by RLFS strand. (B) Distributions of RLFSs and experimental G4s in the proximal promoters (around TSS) of stand-alone protein-coding genes and the protein-coding/protein-coding divergent gene pairs. RLFSs were merged in a strand-specific manner to provide the same scaling with non-overlapping G4. (C) Genome browser shots showing RNA:DNA hybrids/R-loops and G4s in VEGFA, NEAT1, CCND1 and MDM2 gene promoters. Asterisk for DRIP-seq data denotes data from (46). Detailed descriptions of the maps and associations are presented in Supplementary Materials: examples of the RLFSs highly enriched with G repeats strand-specific G4-quadruplexes.
Figure 4.
Figure 4.
Analysis of the paired reversed-forward RLFS loci (PRLs). (A) A schema for the identification of neighbor-paired RLFS loci on the forward and reverse DNA strands. The center of a PRL was defined as the middle point between the rightmost reverse-strand RLFS and the leftmost forward-strand RLFS in each pair. The model assumed that most of the pairs would be functional within such a sequence span and in the distal region approximately corresponding to two nucleosome spans. (B). PRL structure in the FOXO1 region, including the promoter, exon 1 and the 1st intron 5′ splice site. (C) The genome-wide RPL distribution (N = 24 296). TSS, TES, gene body and intergenic regions; they were defined similarly to Figure 2B. (D) The frequencies of the PRLs co-localized with the singleton (orphan) genes and the PRLs co-localized with the gene clusters defined at TSS- and TES- proximity regions. The left panel shows the numbers of genes with RPL with and without localization of other genes at the promoter proximity. The right panel shows the numbers of the genes with RPL with and without localization of other genes at the TES proximity. (E) The bivariate distribution of the number of RLFSs included in the PRL set, observed on the positive and negative DNA strands. For each strand, the power law-like frequency distribution that fit well by the Kolmogorov–Waring function has a long tail on the right side (71). This function specifies many sequence types and families, including RLFS (32,71). (F) Strand-specific DRIPc-seq peak regions density functions (NT2 cells) (47) are associated with PRL regions and asymmetrically localized on the PRL flanks. Strand-specific densities of DRIPc-seq peak regions (replicates 1 and 2) and GRO-cap (right) signals are distributed around the PRL center. The results are shown for the positive and negative DNA strands (depicted in red and blue, respectively). (G) Strand-specific distribution of DRIPc-seq peak regions and GRO-cap signals around the PRL center. The left and central panels show the density of DRIPc-seq peak region for two experimental replicates. The right panel shows the densities of the GRO-cap signals region around the PRL center. The results obtained from the genomes of K562 cells (72). (H) Co-localization analysis of the PRL defined within the SP3 gene promoter region. Experimental data integrated via UCSC genome browser tracks (done via R-loop DB tools (33)), including the RNA:DNA hybrid/R-loop profiles (DRIP-based experiments) and the experimental G4-rich region datasets downloaded from the GSE63874 NCBI GEO data repository. Computationally predicted canonical G4s and non-B DNA structures downloaded from the non-B DNA database https://nonb-abcc.ncifcrf.gov. (I) Co-localization analysis of the PRL predicted within the CREB1 gene promoter region. All tracks are the same as in panel H.
Figure 5.
Figure 5.
Characteristics of the RLFSs associated with transcribed enhancers. (A) Co-localization analysis of the RLFS, H3K4Me1, Pol II Ser5 and DRIP-seq peak regions for K562 cells within transcribed intergenic enhancer regions. Only the enhancers located at least 2 kb away from the annotated genes were considered for the analysis. (B) The distributions of the common RLFS (N = 245), H3K4Me1, Pol II Ser5 and DRIP-seq peak region sequences around enhancer centers. (C) Similarity of the transcription factor overlap ratio values in the DRIP-seq and RLFS regions co-localized with the enhancers. (D) Co-localization analysis of the enhancer-associated RNA:DNA hybrids, RLFS clusters, G4s and transcription activity signals with the enhancer G-rich region. Asterisk for DRIP-seq data denotes data from (46). Other signal profiles are drawn based on the datasets described in ‘Materials and Methods’ section. (E) RLFS and non-B DNA sequence clusters in the e-NKAIN1 enhancer. Data visualization and co-localization analysis was done via integration of the USCS genome browser and R-loop database tracks. Experimental G4-rich region datasets were downloaded from GSE63874 NCBI GEO data repository. Characterization of the structural and functional statuses of the enhancer region was described in ‘Materials and Methods’ section. Computationally predicted canonical G4s and non-B DNA structures were downloaded from non-B DNA database https://nonb-abcc.ncifcrf.gov. Types of 22 non-B DNA sequences are the following (from the left to the right): G4 motif, mirror repeat, short tandem repeat, G4 motif, mirror repeat, G4 motif, direct repeat, short tandem repeat, mirror repeat, G4 motif, G4 motif, mirror repeat, direct repeat, inversed repeat, mirror repeat, inversed repeat, G4 motif, direct repeat, inversed repeat, short tandem repeat, mirror repeat, short tandem repeat. (F) The structural models of R-loop involvement in promoter–enhancer interactions. 1. A nascent eRNA displaces non-template ssDNA in a transcribing gene promoter region and links the active enhancer to the transcribed gene. 2. Two bi-directionally transcribed nascent eRNAs form the enhancer-associated R-loops (eR-loops), leading to a local stabilization of the active enhancer that helps the nascent eRNA to form a non-canonical DNA:RNA hybrid in transcribed gene promoter (e.g. DNA:e-RNA-DNA triplex, e-RNA-mediated R-loop) in trans. 3. A nascent e-RNA displaces a non-template ssDNA near the enhancer, stabilizes an eRNA-mediated R-loop in cis and, via Hoogsteen binding (forming a hybrid G4), links to a non-template ssDNA in an R-loop conformation of a gene promoter in trans. 4. eRNA-protein-DNA complex (or protein-mediated DNA binding) interaction in trans.
Figure 6.
Figure 6.
The extended R-loop models including RNA:DNA hybrids and alternative non-canonical nucleic acid structures that often co-localize and form stable conformations during nascent transcription process. The proposed models include (top left) G4, (top right) G4, triplex and hairpin, (central left) G4, triplex, two hairpins (on the positive and negative strands, respectively) and an i-motif structure, (central right) intra-molecule DNA and DNA:RNA hybrid G4s, (bottom left) intra-molecule DNA G4 and DNA:RNA triplex on the positive strand and (bottom right) the duplicated R-loops formed by a single nascent RNA. Detail description of the models A-F see in Supplementary Materials: Extended R-loop models including RNA:DNA hybrids and alternative non-canonical nucleic acid structures.

Similar articles

Cited by

References

    1. White R.L., Hogness D.S.. R loop mapping of the 18S and 28S sequences in the long and short repeating units of Drosophila melanogaster rDNA. Cell. 1977; 10:177–192. - PubMed
    1. Ratmeyer L., Vinayak R., Zhong Y.Y., Zon G., Wilson W.D.. Sequence specific thermodynamic and structural properties for DNA.RNA Duplexes. Biochemistry. 1994; 33:5298–5304. - PubMed
    1. Drolet M., Phoenix P., Menzel R., Masse E., Liu L.F., Crouch R.J.. Overexpression of RNase H partially complements the growth defect of an Escherichia coli delta topA mutant: R-loop formation is a major problem in the absence of DNA topoisomerase I. Proc. Natl. Acad. Sci. U.S.A. 1995; 92:3526–3530. - PMC - PubMed
    1. Massé E., Drolet M.. Escherichia coli DNA topoisomerase I inhibits R-loop formation by relaxing transcription-induced negative supercoiling. J. Biol. Chem. 1999; 274:16659–16664. - PubMed
    1. Broccoli S., Rallu F., Sanscartier P., Cerritelli S.M., Crouch R.J., Drolet M.. Effects of RNA polymerase modifications on transcription-induced negative supercoiling and associated R-loop formation. Mol. Microbiol. 2004; 52:1769–1779. - PubMed

Publication types

LinkOut - more resources