. 2018 Aug 14;69(18):4349-4362.
doi: 10.1093/jxb/ery237.

Growing cell walls show a gradient of elastic strain across their layers

Affiliations

Growing cell walls show a gradient of elastic strain across their layers

Marcin Lipowczan et al. J Exp Bot. .

Erratum in

Abstract

The relatively thick primary walls of epidermal and collenchyma cells often form waviness on the surface that faces the protoplast when they are released from the tensile in-plane stress that operates in situ. This waviness is a manifestation of buckling that results from the heterogeneity of the elastic strain across the wall. In this study, this heterogeneity was confirmed by the spontaneous bending of isolated wall fragments that were initially flat. We combined the empirical data on the formation of waviness in growing cell walls with computations of the buckled wall shapes. We chose cylindrical-shaped organs with a high degree of longitudinal tissue stress because in such organs the surface deformation that accompanies the removal of the stress is strongly anisotropic and leads to the formation of waviness in which wrinkles on the inner wall surface are always transverse to the organ axis. The computations showed that the strain heterogeneity results from individual or overlaid gradients of pre-stress and stiffness across the wall. The computed wall shapes depend on the assumed wall thickness and mechanical gradients. Thus, a quantitative analysis of the wall waviness that forms after stress removal can be used to assess the mechanical heterogeneity of the cell wall.


Figures

Fig. 1.
Fig. 1.
Cellular parameters used in computations. (A) Transmission electron micrograph showing a portion of radial–longitudinal ultrathin section of a cell wall fragment forming waviness. Lines superimposed on the micrograph were used to measure the wavelength (λ), amplitude (A), and the length of the most wavy layer (white curved line). Arrows indicate the directions L and W labelled in (C). Bar=0.5 µm. (B) Semithin cross-section (light microscopy, toluidine blue staining) of a sunflower epidermal cell. Parameters used for the assessment of in-plane wall stress are marked on the micrograph and its schematic representation (right): the thickness of the outer and inner periclinal cell walls (two and twi, respectively); the surface area of these walls (swo and swi, respectively); and the height (dTr) and surface area (scTr) of the cell lumen. Mean ±SD values of the measurements for 10 cells are: two=2.2 ± 0.3 μm; twi=0.5 ± 0.1 μm; swo=36.4 ± 8.9 μm2; swi=10.8 ± 3.6 μm2; dTr=23.5 ± 2.0 μm; scTr=293.9 ± 55.7 μm2. Bar=10 µm. (C) Diagram of part of an epidermal strip with waviness formed on the protoplast face of the outer periclinal walls of elongated epidermal cells; the long axis of the cells is in the direction L. Arrows indicate the three directions in the cell wall referred to in this paper: in-plane longitudinal (L); in-plane transverse (T); and across the wall (W).
Fig. 2.
Fig. 2.
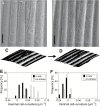
Changes in cell curvature of the outer periclinal cell wall of the epidermis of sunflower hypocotyl due to stress removal. (A, B) Scanning electron micrographs of replicas taken from the same part of the epidermis in situ (A) and after stress removal (B). Regions of the cell surface taken for cell curvature computation are outlined. Short lines within the outlined regions represent directions of maximal cell curvature; the line length is proportional to the cell curvature value. Note that the outlines do not provide landmarks for strain computation. Bars=20 µm. (C, D) Side views of example portions of the reconstructed surfaces shown in (A, B). (E, F) Histograms of maximal (E) and minimal (F) cell curvature values for the cell surface in situ and after stress removal, measured in the regions outlined in (A, B).
Fig. 3.
Fig. 3.
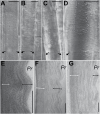
Cell wall waviness after stress removal. (A–D) Outer periclinal walls of sunflower hypocotyl epidermis (A), epidermis of barley coleoptile (B), epidermis of dandelion peduncle (C) and subepidermal collenchyma of dandelion peduncle (D), after isolation and plasmolysis of epidermal strips, observed by Nomarski microscopy. In these optical sections in the wall plane, the waviness appears as alternating light and dark bands. The long axis of the cells is vertical; black arrows mark the anticlinal walls, which are perpendicular to the image plane. Bars=10 µm. (E–G) Transmission electron micrographs of longitudinal–radial sections of sunflower epidermis (E), barley epidermis (F), and dandelion collenchyma (G). Wall fragments differ in the thickness of the straight wall portion (white arrows) and the portion with nearly uniform amplitude (black arrows). Pr, Protoplast face of the wall. Note that although the collenchyma walls of adjacent cells are attached by a middle lamella, unlike the superficial walls of epidermal cells, the visible collenchyma wall fragment in (G) belongs to one cell only because it became separated from the adjacent cell wall during tissue shrinkage. Bars=1 µm.
Fig. 4.
Fig. 4.
Variation of parameters characterizing cell wall waviness after stress removal. (A, B) Spatial variation of the amplitude of waves formed by layers of individual cell wall fragments in sunflower (A) and barley (B). In (A), wall 1 is the same as that shown in Fig. 3E; wall 4 in (B) is shown in Fig. 3F. All the amplitude and distance values were normalized (each value was divided by the maximal parameter value for the given cell wall). (C, D) Correlations between cell wall parameters. Lines are plotted based on linear regression analysis between the wavelength and amplitude of the innermost cell wall layers (sunflower: y=0.04x+0.04; R2=0.77; barley: y=0.11x–0.01; R2=0.65; dandelion: y=0.1x–0.07; R2=0.99), or between the total cell wall thickness and wavelength (sunflower: y=0.61x+0.56; R2=0.70; barley: y=0.45x+0.41; R2=0.36; dandelion: y=0.17x+0.61; R2=0.90).
Fig. 5.
Fig. 5.
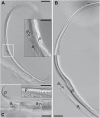
Deformation of isolated fragments of outer periclinal cell walls of sunflower hypocotyl. All the sections are shown in the longitudinal–radial plane, the same as the TEM sections in Fig. 3E–G. The fragments of outer periclinal wall (p), isolated in isotonic (A), hypotonic (B), or hypertonic (C) solution, bend outward from the organ surface. Note that fragments of the same wall that are attached to the longitudinal (aL) and transverse (aT) anticlinal walls remain nearly straight. The white frame in (A) indicates the wall fragment shown in the inset. The magnified inset in (C) shows waviness of the periclinal wall fragment that remains attached to the anticlinal walls. Bars=20 µm (A, C), 10 µm (B, insets in A and C).
Fig. 6.
Fig. 6.
Assumptions used in the wall shape computation. (A) A cell wall fragment is represented by three plates embedded in an elastic medium (light grey). Plate 1 faces the protoplast. The gradients of in-plane modulus and pre-stress in the wall fragment are directed across the wall (direction W in Fig. 1C). In schematic representations of gradients, the highest values of in-plane modulus (E) or pre-stress (σ) are at the base of triangles, the lowest are at the apex. (B) In situ (upper panel), all the plates are straight. After stress removal, plates 1 and 2 (white) shrink to a lesser extent than plate 3 (dark grey), as shown in the middle panel. If all the plates are bound by the elastic medium, plates 1 and 2 buckle while plate 3 only shrinks (lower panel). For calculation of the energy required for stretching of the wall in the direction across the wall, plates are represented by surfaces (1, 2, and 3) marked with dashed lines in (A–D). (C, D) Upper panels refer to the wall in situ, i.e. under tensile stress; lower panels refer to the wall after stress removal. (C) The bending energy of plate 1 or 2 is computed for a plate part whose length equals the assumed wavelength divided into eight portions (an exemplary part of a plate, whose total length is twice the wavelength, is shaded) and multiplied by the wavenumber in order to obtain the energy for the whole plate. The plate ends are fixed. (D) The energy required for stretching in the direction across the cell wall is computed on the basis of the increase in distance between surfaces that represent the shapes of the three plates. All the symbols refer to parameters used in computations presented in Supplementary Protocol S3: distances between surfaces 1 and 2 (h1-2) and surfaces 2 and 3 (h2-3); increases in these distances after stress removal (x1-2 and x2-3, respectively); thickness of plates 1, 2, and 3 (h1, h2, h3); length of the plate portion, equal to one-quarter of the wavelength, taken for computation of bending energy (L) and its change due to bending (ΔL). (E) Example plot of energy components required for various wavenumbers, for the pre-stress gradient, where h1=1 μm; EW=0.5 E2; E1,2,3=72 MPa; σ1=0.29 MPa; σ2=3.74 MPa; σ3=7.2 MPa.
Fig. 7.
Fig. 7.
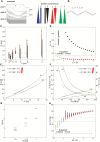
Response of the buckled plate shapes to the assumed cell wall parameters. (A) Parameters of the plate shape and the colour code that was used in the plots (C-H) in order to label the different gradient combinations: outward pre-stress gradient (blue); inward modulus gradient (black); outward pre-stress gradient overlaid by inward, i.e. opposite, modulus gradient (red); outward pre-stress overlaid by outward, i.e. aligned, modulus gradient (green). (B) Waviness characterized by different λ/A; the blue wave is ‘flattened’ compared to the red one. (C-H) Amplitudes and wavelengths of buckled plates for the assumed parameters. The amplitude and wavelength values within the range of empirical values are outlined in (C). Dashed lines delimit the range of the empirical values of A2/A1 in (H). The arrows in (D, H) indicate the directions of the increasing steepness of the modulus or strain gradient. The relationship between the shape and the mechanical parameters of plate 1 are plotted in (E, F) for the opposite gradients in the modulus and pre-stress; solutions for the other gradient combinations are presented in Fig. S4. The curves (c1-4) were fitted to the dots that represent the minimal energy solutions that were obtained for h1=0.75 μm; σ3=7.2 MPa; EW=0.5E2; and two values of E1/E3. Curves c1, 2 in (E, F) are given by the equation y=aebx+cedx, where in (E): a>0; b<1; c,d(1,0); in (F): a>1; b,d(1,0);c(0,1). Each curve was fitted to the amplitude values that were related to the same wavelength. For curves c3, 4 in (F) the equation is y=ax+b, where a>1; b<0. R2 >0.99 for all of the curves. In (C, G, H) the points that represent the different gradient combinations are offset laterally in order to improve visibility.

Similar articles

Cited by

References

    1. Abasolo W, Eder M, Yamauchi K, et al. . 2009. Pectin may hinder the unfolding of xyloglucan chains during cell deformation: implications of the mechanical performance of Arabidopsis hypocotyls with pectin alterations. Molecular Plant 2, 990–999. - PubMed
    1. Alméras T, Clair B. 2016. Critical review on the mechanisms of maturation stress generation in trees. Journal of the Royal Society Interface 13, 20160550. - PMC - PubMed
    1. Bashline L, Lei L, Li S, Gu Y. 2014. Cell wall, cytoskeleton, and cell expansion in higher plants. Molecular Plant 7, 586–600. - PubMed
    1. Baskin TI, Jensen OE. 2013. On the role of stress anisotropy in the growth of stems. Journal of Experimental Botany 64, 4697–4707. - PubMed
    1. Basu D, Haswell ES. 2017. Plant mechanosensitive ion channels: an ocean of possibilities. Current Opinion in Plant Biology 40, 43–48. - PMC - PubMed

Publication types