. 2018 Jun 27;19(1):246.
doi: 10.1186/s12859-018-2250-y.

PanACEA: a bioinformatics tool for the exploration and visualization of bacterial pan-chromosomes

Affiliations

PanACEA: a bioinformatics tool for the exploration and visualization of bacterial pan-chromosomes

Thomas H Clarke et al. BMC Bioinformatics. .

Abstract

Background: Bacterial pan-genomes, comprised of conserved and variable genes across multiple sequenced bacterial genomes, allow for identification of genomic regions that are phylogenetically discriminating or functionally important. Pan-genomes consist of large amounts of data, which can restrict researchers ability to locate and analyze these regions. Multiple software packages are available to visualize pan-genomes, but currently their ability to address these concerns are limited by using only pre-computed data sets, prioritizing core over variable gene clusters, or by not accounting for pan-chromosome positioning in the viewer.

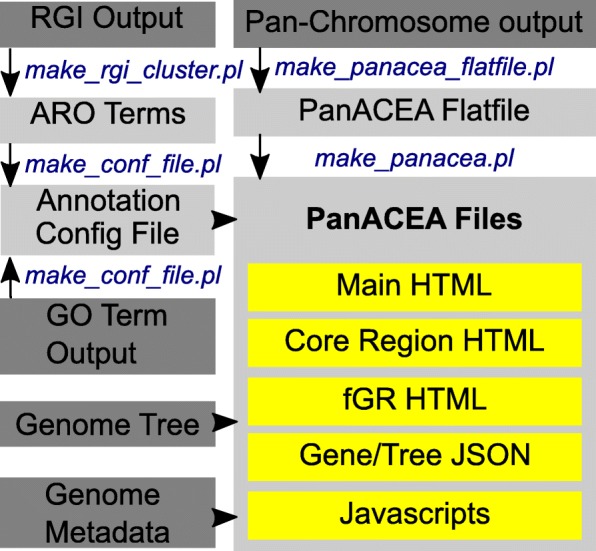
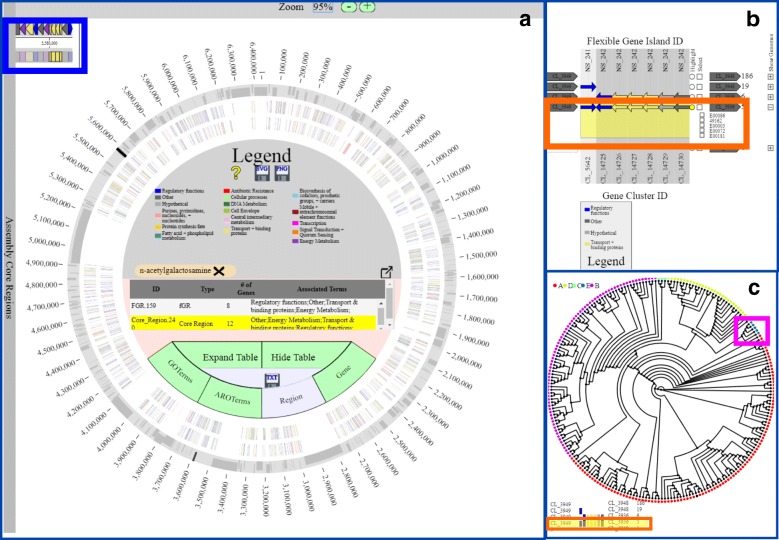
Results: We introduce PanACEA (Pan-genome Atlas with Chromosome Explorer and Analyzer), which utilizes locally-computed interactive web-pages to view ordered pan-genome data. It consists of multi-tiered, hierarchical display pages that extend from pan-chromosomes to both core and variable regions to single genes. Regions and genes are functionally annotated to allow for rapid searching and visual identification of regions of interest with the option that user-supplied genomic phylogenies and metadata can be incorporated. PanACEA's memory and time requirements are within the capacities of standard laptops. The capability of PanACEA as a research tool is demonstrated by highlighting a variable region important in differentiating strains of Enterobacter hormaechei.

Conclusions: PanACEA can rapidly translate the results of pan-chromosome programs into an intuitive and interactive visual representation. It will empower researchers to visually explore and identify regions of the pan-chromosome that are most biologically interesting, and to obtain publication quality images of these regions.

Keywords: Pan-chromosome; Pan-genome; PanOCT; Viewer; Visualization; fGI; fGR.


Conflict of interest statement

Consent for publication

None declared.

Competing interests

The authors declare that they have no competing interests.

Publisher’s Note

Springer Nature remains neutral with regard to jurisdictional claims in published maps and institutional affiliations.

Figures

Fig. 1
Fig. 1
PanACEA Pipeline Flowchart. The PanACEA pipeline with the initial files shown in dark gray, the PanACEA PERL scripts shown in blue font, the resulting PanACEA intermediate files shown in light gray, and the final files shown in yellow. The final PanACEA output includes all the HTML pages, JSON files, and Javascripts scripts necessary to run the viewer. The RGI output referenced is generated by the RGI software package. Additional information on the requirements for the input files can be found in the user manual located on the GitHub page
Fig. 2
Fig. 2
PanACEA Views of E. hormaechei gat and aga Operons. The PanACEA pan-chromosome images (a), fGR view (b), and phylogeny (c) showing the gat operon that can differentiate E. hormaechei subsp. hormaechei from other subsp. [12]. The location of the fGI in b and c is highlighted with the orange box. The default coloring scheme is shown in (a) with variable regions in dark gray and core regions in light gray. The variable regions are also shown at 0.75 height and on alternating sides of the chromosome to help differentiate small neighboring regions. The bounding core region that contains the aga operon is shown in the preview panel highlighted by the light blue box in a. The cluster of genomes containing the gat operon fGI are annotated as E and are highlighted in the genome phylogeny in c using the pink box. The images in b and c are derived from PNGs downloaded directly from the website. Additional information about the visualization can be found in the user manual located on the GitHub page

References

    1. Tettelin H, Masignani V, Cieslewicz MJ, Donati C, Medini D, Ward NL, et al. Genome analysis of multiple pathogenic isolates of Streptococcus agalactiae: implications for the microbial pan-genome. Proc Natl Acad Sci U S A. 2005;102:13950–13955. doi: 10.1073/pnas.0506758102. - DOI - PMC - PubMed
    1. Remm M, Storm CEV, Sonnhammer ELL. Automatic clustering of orthologs and in-paralogs from pairwise species comparisons. J Mol Biol. 2001;314:1041–1052. doi: 10.1006/jmbi.2000.5197. - DOI - PubMed
    1. Li L, Stoeckert CJ, Roos DS. OrthoMCL: identification of Ortholog groups for eukaryotic genomes. Genome Res. 2003;13:2178–2189. doi: 10.1101/gr.1224503. - DOI - PMC - PubMed
    1. Fouts DE, Brinkac L, Beck E, Inman J, Sutton G. PanOCT: automated clustering of orthologs using conserved gene neighborhood for pan-genomic analysis of bacterial strains and closely related species. Nucleic Acids Res. 2012;40:e172. doi: 10.1093/nar/gks757. - DOI - PMC - PubMed
    1. Ozer EA, Allen JP, Hauser AR. Characterization of the core and accessory genomes of Pseudomonas aeruginosa using bioinformatic tools spine and AGEnt. BMC Genomics. 2014;15:737. doi: 10.1186/1471-2164-15-737. - DOI - PMC - PubMed

Publication types